Evaluating Bat Flight and Temperature
Introduction
This is an ecological study about bats, and the overall study revolves around to the fact of the temperatures that evolve around the fact that the flight time and the temperature are relevant. This study is to evaluate whether this fact is true or not. If the temperatures are evaluated along with the flight time of each individual bat, then the possible outcome can be evaluated, measured and combined to provide a bigger picture. In order to evaluate this further, it can be observed that the report would not only evaluate the variables individually, but would also evaluate the relationship and the error or bias in the research study.
Descriptive Statistics
There are two key variables that are under study here, the first variable is based on descriptive statistics, and it can be observed that these are the temperature and the flight time for bats when they leave their roosts. Both of these variables would be illustrated separately.
Temperature at Sunset
This is the temperature in terms of degree Celsius, the point of measurement is sunset. Since more than one events are evaluated, therefore, the temperature is averaged, and the bats are evaluated. The Summary Statistics for this is as follows:
These are the results of Temperature, and it can be observed that there are no missing values, median and mean are the same, indicating that there is a minimal skewness, the kurtosis is high. in addition, it can be observed that there is an standard deviation of 1.34 degrees in this batch, indicating that it was studied around the same frame.
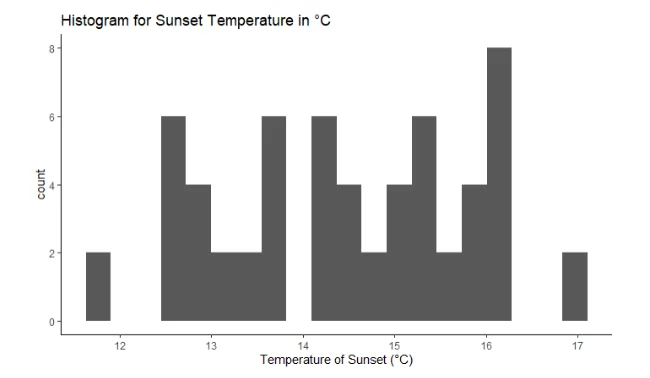
This is the histogram of Sunset, and it can be observed that most of the days had between 14 and 16 degrees, with most around 16. Though there are temperatures missing between 12 and 13, 14, and between 16 and 17.
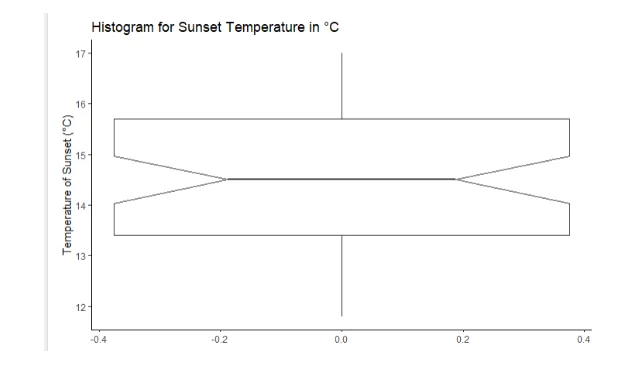
This is the histogram of sunset, and it can be observed that the temperature has a uniformity, with little skewness, additionally, the central tendency is between 14 and 15. additionally most of the distribution is between 13 and 16, with 12 as minimum and 17 as maximum, and a range of around 5 in the observed temperatures.
Flight Time in Minutes
The second variable is Flight Time in Minutes. This illustrates the total time for each bat, aggregated. The previous variable of temperature was averaged, but this variable is summed. This is to evaluate the total time by each bat, in the observed time duration. The summary statistics for flight time in minutes is as follows:
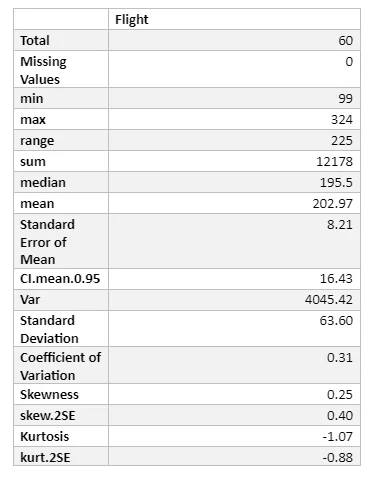
In terms of the evaluation of flight time, it can be observed that mean is higher than the median, indicating a small positive skewness, the kurtosis here is also high and negative as well. More over there are no missing values, and the standard deviation is of 63.6 minutes. It has a low coefficient of variation, but its confidence interval is 16.43, which is high as compared to the rest of the variable specifications. In addition to the summary statistics, some more exploration is provided in terms of graphical representation. This is illustrated as follows:
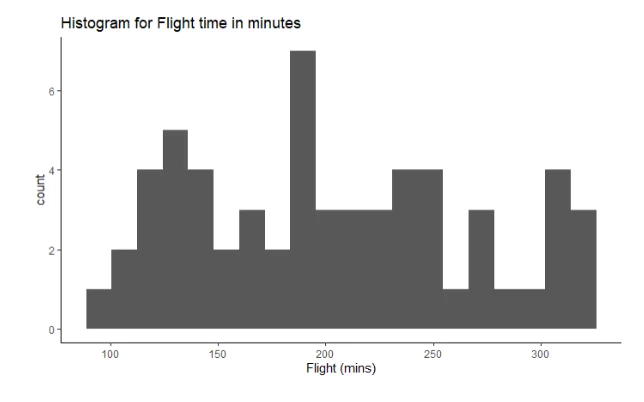
This is the histogram and it is almost normally distributed with 200 minutes as the most common flight times. Additionally, it spreads between 0 and 400 in terms of Additionally, after the main peak, there are two secondary peaks one close to 125 while second more than 300.
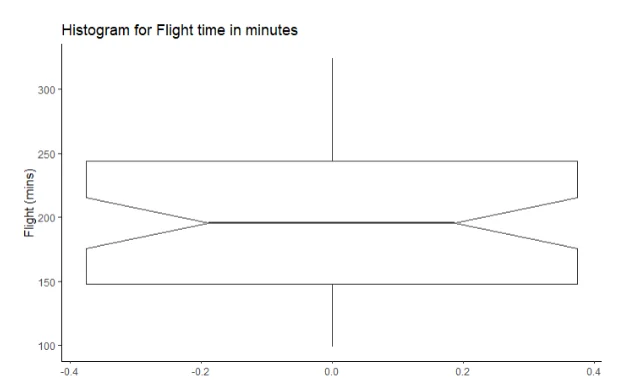
This is the box plot for Flight time in minutes. Additionally, it can be observed that the median value is around 200, there are no outliers in the sampled bats, additionally, it can be said that the this has skewness as the distance towards maximum and 3rd quartile is more than 1st and minimum value.
Relationship Statistics
The second part is the relationship statistics, and it has been done in two parts, the first is the test for statistical analysis in terms of correlation, while the second is the test of Regression or causal relationship. Each of these are illustrated as follows:
Correlation Analysis
The correlation analysis is the relationship that is non-directional, meaning it does not tell the influence on the dependent of the independent, but it does tell the strength of their mutual relationship. The results for correlation is as follows:

This indicates that the relationship between the two is positive and has a medium magnitude. Additionally, it can also be observed that the relationship is positive, meaning that if one increases the second would also increase with the strength given above.
Regression Analysis
A regression is a causal relationship and it observes the impact of one variable over the other, the results of both variables are as follows:
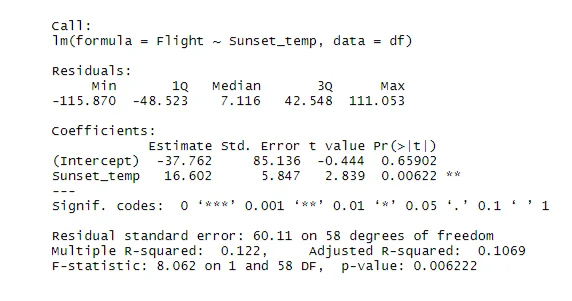
This indicates that the temperature is significant and has a predictive power of 12.2%, this power is low, but considering the factors involved this has a very low propensity and a high yield, as it is significant. Additionally, it has a positive relationship, and it evaluates that with each increase in a single degree Celsius, 16 minutes of total flight time would be increased. This can be seen more clearly in the following chart:
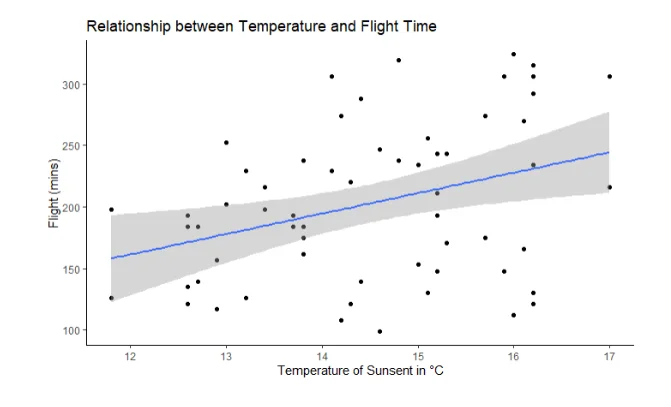
In terms of evaluation, it can be observed that with the temperature the time for flight increases, though it has a wide confidence interval due to scattered results, but in an overall context it tends to be aligned.
Study of Bias
In the evaluation it can be observed that that the graphical evaluations would be done for both residuals and other evaluations, to find if the model was a good fit.
Residuals vs Fitted
The residuals vs fitted chart yields the following results, as it is an important chart that evaluates whether the residuals have some sort of relationship.
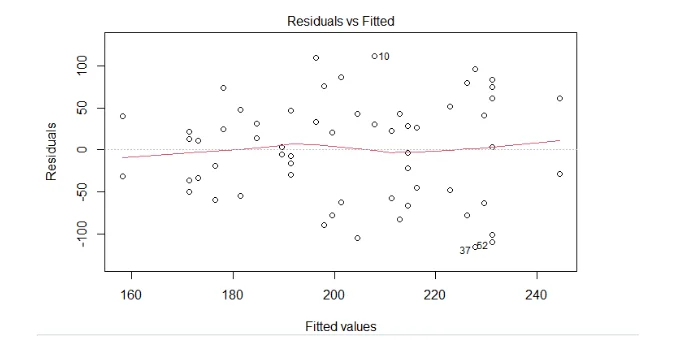
This relationship is almost flat indicating that there is no relationship between the two, and that is a good sign, if there were a relationship between the two, the model would have to be regarded as less than perfect.
Normal Q-Q
The relationship or the Normal QQ plot diagnostics indicate that it should be in diagonal for a good plot, if it is not in diagonal, it would mean that the standardized residuals and the quartiles does not have a relationship, indicating an imperfect model.
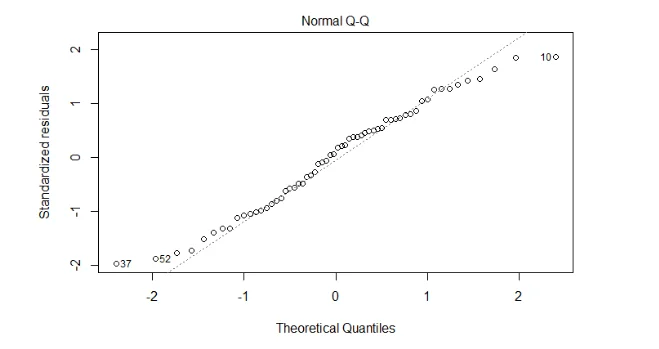
This plot indicates that the quartile dots are almost diagonal, this too indicates that this model is close to perfect, fitting a line almost perfectly.
Scale-Location Test
The scale location test is another graphical test that makes the overall results in sync with the root of standardized residuals. The chart is as follows:
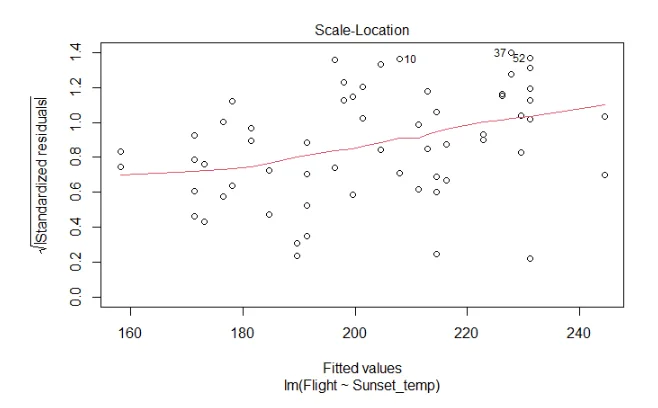
This chart indicates that their relationship is almost flat, indicating that the model performs close to best in terms of the Scale-Location Plot. This not only evaluates the fitted values for flight times but also checks it with the root of standardized residuals.

Cook’s Distance
This is the model or the measure of changing if any observation is removed. An ideal model should not change much, and should be horizontal or close to it, the results of this model are as follows:
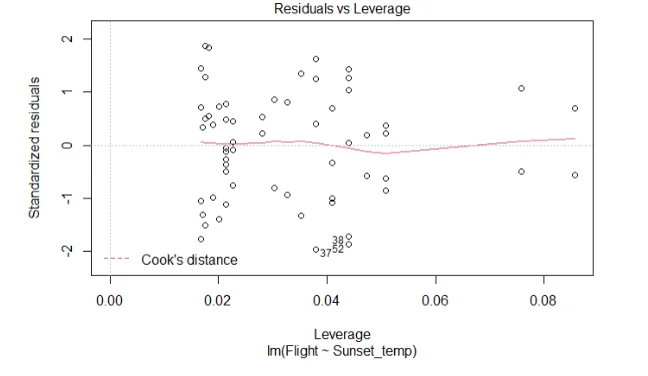
In observation, there is some fluctuation, but it is close to minimal, and it can be observed that this model passes the Cook’s distance and evaluate the overall synthesis of the potential.
Summary
It can be summarized that both the variables are free from outliers and have a minimal skewness. Additionally, tends to be close to normal distribution. Furthermore, it can also be illustrated that there is medium correlation between them that is positive as well. Moreover, it can be said that the temperature significantly and positively impacts the flight time of bats. This model passes the tests, and can be regarded as a model that is close to actual values, and can have implied relationship, as the residuals make to specific pattern after the model has been applied. So, in short, it can be said that when temperature rises, the flight time of bats also rise.
- 24/7 Customer Support
- 100% Customer Satisfaction
- No Privacy Violation
- Quick Services
- Subject Experts


