Predicting International Equity Market Returns
Stock Momentum
This study aims at investigating whether international equity market returns can be predicted. To achieve the objective, the study will use the total return on the stock market indices of the selected countries by ranking their equity market and taking a long-short position in the equity indices of the selected countries. For this case, the stock market indices will be listed according to the stock market momentum. Fama & French (2012) defined energy as the tendency of assets with excellent or poor past performance to outperform or underachieve in the future. This situation is also used to explain the most pervasive anomalies ever discovered. From the analysis conducted there is evidence of momentum across various international equities in many economies. This analysis reveals that momentum anomaly is a new dimension that examines the possibility of applying it to country-based investment strategies. To achieve this objective, the study formulates a hypothesis that the impacts of moments ought to be observable in the anomalies if either is existing in the constituents of a portfolio on inter-market anomalies. The analyses will investigate the occurrence of momentum, not only in the case of financial assets but also for the international equity market anomalies. To achieve these objectives, the analyses will examine the equity markets of 23 countries between 1998 to 2018. This concept is not a new concept, and therefore, the reviews will also use the information presented to establish a valid argument and conclusion on various theories of momentum. Previous studies have also revealed that it is possible to use momentum strategies to successfully rank the countries in the international equity market, using their respective indices. Even so, all other papers focused on the stock-level facet, and thus this analysis will majorly constitute a natural extension of country-level data.

Data and Preparation
The study is based on a monthly equity market returns on the international stock market indices from 78 nations which are; Australia, Austria, Belgium, Canada, Denmark, Finland, France, Germany, Greece, Hong Kong, Ireland, Italy, Japan, Netherlands, New Zealand, Norway, US, UK, Switzerland, Sweden, Spain, Singapore, and Portugal. All the data collected was derived from the EDHEC business school database. All the MSCI indices are sued for all the countries that are included in the research to maintain the reliability of return calculation methodology. Capitalization-weighted total return indices calculated the returns. For the sake of uniformity in the analysis section, the study only used the total stock return in dollars. The consistency is not just for the analysis, but are an integral part of establishing reliable results. Richardson, Tuna, & Wysocki (2010) argued that there are two types of momentum. The first is the original short-term momentum with 6 months sorting, while the second one involves the standard momentum that is informed by 12-months momentum, with the most recent month left out of the calculation. This analysis will use short-term momentum (6-months) due to data limitations. Choi (2013) stated that the primary source of momentum is the average performance over the months. However, so far, no research has examined the stock market indices using this model.
Stock Indices Ranking
From the data collected from 1998 to 2018, Hong Kong emerged as the best country in the term equity market compared to other
1998
In July 1998, Hong Kong had the best equity market as a compared index and was closely followed by the Netherlands. In the same month, New Zealand reported the lowest equity market index as compared to the others. Generally, July recorded the lowest stock index as compared to other months, while December recorded the highest stock index.
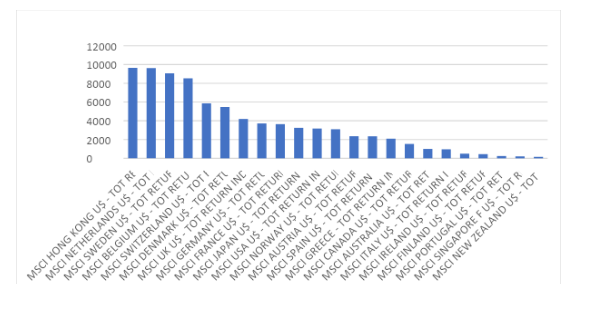
In August, Hong Kong maintained its position and again followed by New Zealand, while the worst performing country was New Zealand. However, in the same month, Belgium overtook Sweden, as the economy with the highest stock index as shown below
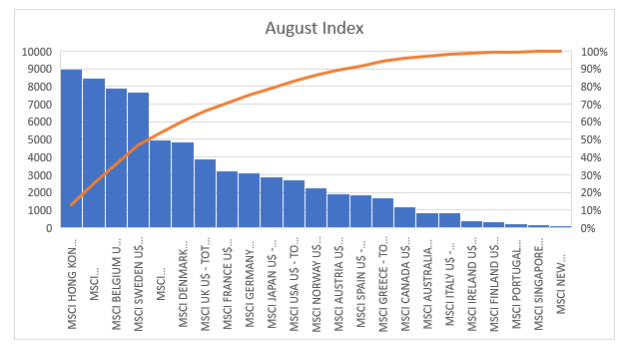
The same results were also repeated in September apart from the fact that Spain’s and Japan’s equity market index improved as compared to the other countries. It was however noted that the stock market indices grow gradually starting from the least during the first month/ the opening month, and closing at the peak as shown in the graph below
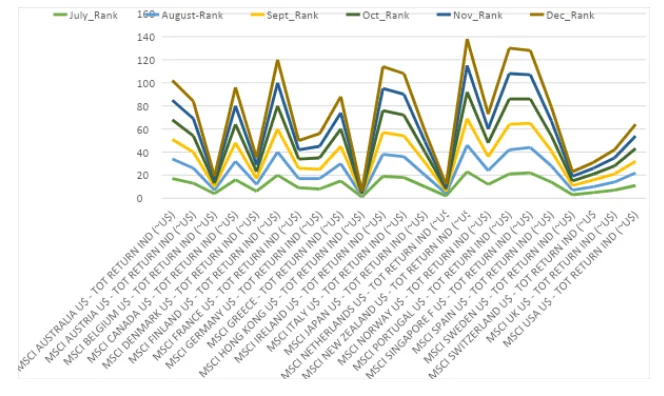
1999
In the first month of 1999 that is July, Hong Kong managed to retain its position as the leading country in terms of the stock market index. Sweden improved to the second position as compared to the same month in the last financial year. The Netherlands dropped from the second position to the third position. New Zealand retained a constant position in comparison to other countries in the stock market, as shown below
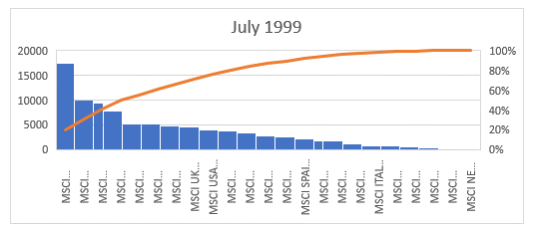
In August the stock market indices remained relatively equal although almost all countries recorded a higher stock index as compared to the previous months as shown in the figure below.
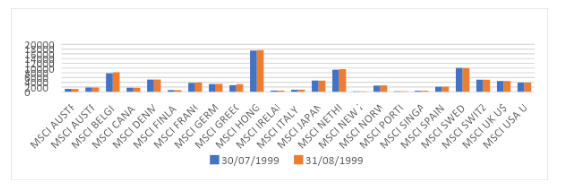
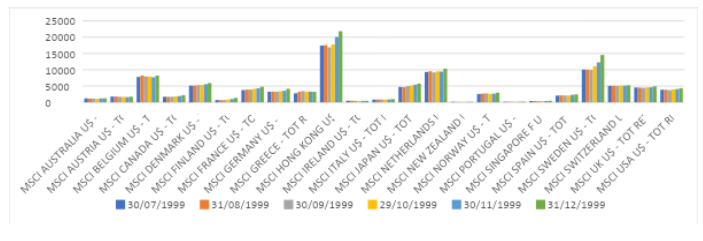
Generally, the closing month which is December, recorded the highest stock index in all countries. From the data, it is clear that the stock market grew gradually from July to December.
Results
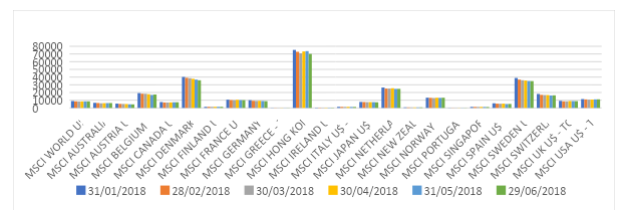
In general, it can be said, that in the opening months, the stock market performed poorly, while in the last month it performed at its best. Regularly, Hong Kong recorded the best results throughout the 10 years followed by Sweden, and then Denmark while New Zealand recorded the least equity market index. Most Nordic countries also presented a positive effect as their respective stock market indices, while as South Pacific countries such as Singapore, and New Zealand recorded poor results. In 2018, however, the New Zealand stock exchange had started to show signs of improvement as compared to the previous years. The same can be said about Denmark. However, contrary to other years, January 2018 recorded a higher stock index as compared to other years, while the stocks closed in June at a lower index, as shown below.
Anomalies
From the analysis, we try to investigate whether returns are affected by market anomalies. The study attempts to analyse the impacts of momentum in each country’s anomalies. In this case, the study will specialise on seasonal anomalies, where countries systematically exhibit high or low returns in the same month every year (Kahneman & Tversky, 1979). For instance, a high return in January is an indicator of good performance over the entire year in the stock market; this anomaly is referred to as the January effect.
The January Effect
This effect is felt, when the equity market performs poor in December, but revamps in January. For example, in December 2011, Australia recorded a low stock index, while in January 2012, the country experienced an increase from $4283.597 to $4661.378. The same was also observed in Austria between 2011 to 2012, where the state recorded a stock index of $2650.311 in December 2011, and later improved to $2923.183 in January 2012. In the same period, Belgium recorded a stock index of $7600.05in December 2011 and enhanced in January 2012 by filing an index of $7899.339.
Long-short Positions in the equity Indices
A long position involves a situation where investors hold stocks, anticipating that there will be increase in value of the stock in future, while a short position consists of the process where investors hope that the price of the stock will decrease in the near future (Clare, Sapuric, & Todorovic, 2010) and therefore sell the shares at a higher rate than the anticipated long term value, within a short period. In short positions, investors hope to purchase the stock at a reduced price and earn a profit (Zaremba, 2015). Countries whose stock market has been continually performing well throughout histories such as Hong Kong, Belgium, and the Netherlands have long positions in the market, while those that have been recording lower stock indices such as New Zealand, Ireland, and Portugal have a short position in the market. The long-short strategy has been used in these countries whereby, the economies with previous high returns like Hong Kong have maintained have maintained a constant high rank over the years, and has experienced a gradual increase in the stock market as shown in the figure below, which compares the stock market growth between the best performing, and the worst performing stock index market. From the figure, it is clear the Hong Kong’s stock market has been gradually on the rise, while New Zealand’s equity market has remained relatively stagnant over the years. Ozdagli (2012) confirms the same analogy by stating that applying the momentum indicator to rank the stock indices of countries, states with the highest stock index momentum are expected to perform well continuously and obtain most senior ranks, while stocks with lower stock index momentum are likely to accomplish worse and attain low ranks.
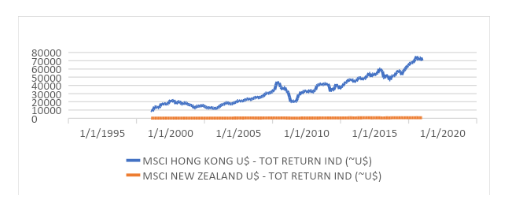
Countries with high returns on equity outperform states with low yields. However, both long and short positions are strategies that are used by stakeholders to attain different outcomes, and in most cases, long and short positions simultaneously to generate income.
Tools of Evaluation
Charting on Different Time Frames
Investors analyse price movements to try to predict price changes. The two core variables for technical analysis are the specific technical indicators and the considered time frames that an investor decides to utilize. Most technical analysts prefer to examine time frames on a monthly or yearly basis where the investors trading model determines each choice (Haugen & Baker, 1996). Short time traders will open and close a trading position within a day and prefer analysing the price movement on a shorter period. Long-term traders prefer to hold stocks for long periods, and would explain the market using days or even weeks. In this case, a short-term trader would evaluate the stock market in months, while a long term will determine the market in years.
Fibonacci Retracements
Fibonacci levels is another analytical tool. The Fibonacci ratio is mostly used to locate the trading prospects and both trade entry and profit targets that arise during continued trends. After security has been continuously in a progression move or downtrend for some period, there is a frequently corrective retracement in the reverse direction before prices resume the overall long term trend. This tool is efficient in identifying stocks that are viable and have a low-risk trade entry point (Kraft, Leone, & Wasley, 2007). For example, if a sharholder wants to invest in the Greek stock market, and is guided by the Fibonacci Retracements, they are likely to join the market in 2003, where the stock market previously recorded very low indices, and then revamped to a continued rapid growth up to its peak in 2007, and then it started falling again. Using the Fibonacci Retracements an investor is likely to join the market in 2003 and sell the shares at a better price in 2007.

From these tools, it is clear that both long and short positions will lead some amount of returns. However, long positions are likely to generate more returns depending on the investor’s ability to predict the future. For example, in the case of Greece, if an investor decides to invest between 2004-2005 (short-term), they are likely to achieve some profits. However, the one that invests from 2004 to 2007 (long term) is likely to get more returns. At the end of the day what is important is that both investors will get some returns. Using time as a variable to rank the stock market indices, countries that performed well over the first month continue to outperform the relatively non-performing stock markets in the next months.
Ranking Months
When ranking months in determining the month that recorded the highest stock value ever, January 2018 emerged as the month with the highest stock index, then followed by February 2018, then December 2017. It should be noted that the stock market was at its peak between 2017 to 2018, with 2018 recording the best values. The ranking and forecasting figure have been attached in the excel sheet.

Conclusion
From the analysis, it is clear that both long and short positions are profitable, but long posts tend to be more profitable if the investor is keen on analysing the future of the market. Based on the stock performance of the 23 countries, it would be valid to conclude that stocks market that performs well over the past months, continue performing well even in the future.
Continue your journey with our comprehensive guide to Influencers' Impact on Cosmetic Purchases .
References
Choi, J. (2013). What drives the value premium? The role of asset risk and leverage. The Review of Financial Studies, 26(11), 2845-2875.
Clare, A., Sapuric, S., & Todorovic, N. (2010). Quantitative or momentum-based multi-style rotation? UK experience. Journal of Asset Management, 10(6), 370-381.
Fama, E. F., & French, K. R. (2012). Size, value, and momentum in international stock returns. Journal of financial economics, 105(3), 457-472.
Haugen, R. A., & Baker, N. L. (1996). Commonality in the determinants of expected stock returns. Journal of Financial Economics, 41(3), 401-439.
Kahneman, D., & Tversky, A. (1979). Prospect Theory: An Analysis of Decision under Risk. Econometrica 47 (2): 263-92.. 1984. Choices, Values, and Frames." American Psychologist, 39, 341-50.
Kraft, A., Leone, A. J., & Wasley, C. E. (2007). Regression‐based tests of the market pricing of accounting numbers: The Mishkin test and ordinary least squares. Journal of Accounting Research, 45(5), 1081-1114.
Ozdagli, A. K. (2012). Financial leverage, corporate investment, and stock returns. The Review of Financial Studies, 25(4), 1033-1069.
Richardson, S., Tuna, I., & Wysocki, P. (2010). Accounting anomalies and fundamental analysis: A review of recent research advances. Journal of Accounting and Economics, 50(2-3), 410-454.
Zaremba, A. (2015). Country selection strategies based on quality. Managerial Finance, 41(12), 1336-1356.
- 24/7 Customer Support
- 100% Customer Satisfaction
- No Privacy Violation
- Quick Services
- Subject Experts


