Red Zone's Mobile Market Performance
Introduction
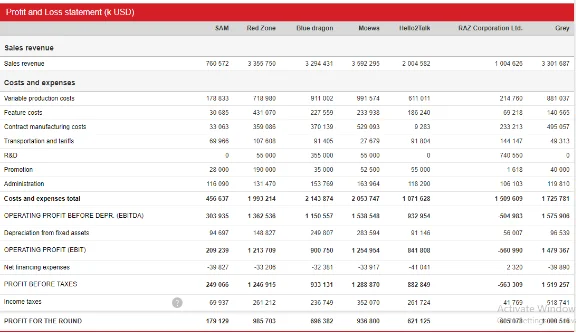
The number of competing mobile phone manufacturers within the existing industry are seven in number and the objective of such organizations is to avail greater profit as well as market shares in the existing market scenario. Amongst these seven, the company of Red Zone could be considered to be one of the leading performers concerning the overall attainment of market shares and financial objective attainment. The Red Zone has 17.51% of market share and currently the company is at the second position in terms of market share, preceded by Blue Dragon and the company Moews follows the market share of the Red Zone immediately. The sales revenue of the Red Zone is $3.55 billion and this is preceded by Moews ($3.59 billion) and followed immediately by Grey with $3.30 billion of sales revenue. Red Zone had achieved $985 million in profit and this is the 2nd highest, in terms of profit, within the industry. The company consistently manufactures Tech 1 which has been offered to Asia and USA, Tech 2 which has been offered to USA and Europe and finally, Tech 3 which has been launched at Asia and Europe. The selected company under consideration has been primarily competing with Blue Dragon and Grey as well as Meows in terms of percentage of market shares. Red Zone owns 12 different production plants within the USA and these plants have a capacity utilization extent of 60%n and 5 other plants are located at Asia with 92% utilization of the capacities of such plants.

Industrial analysis
As could be ascertained from the available information regarding the business scenario presented at the game report, the resource profiles of the seven competing mobile phone manufacturing organizations are similar. The three covered regions of Asia, Europe and USA have extensive coverage of mobile networks involving the entirety of the service inventory of Tech 1, 2, 3 and 4. In this respect, as per the available data, the product range selection is completely incumbent upon the decision of the manufacturing organization concerning manufacturing of any singular or multiple product types. Then gradual movement of the concerned market towards the maturing phase could indicate a decline in the growth rates of the company within the upcoming years and this involves the growth rate to be below 20% at the USA and below that of 30% within Asia and the growth rate at Europe would be approximately 15%.
Porter's Five Forces Analysis
Competitive Rivalry
In this context, the singular factor which could provide effective differentiation amongst the seven competing mobile phone manufacturing organizations hitherto mentioned in the CESIM report, is the mechanism of formulation of decisions and utilization of consistent strategic business approaches by the companies under consideration. The coverage area is extended throughout Asia, Europe and USA and this contributes additionally in the prospect of competition amongst the companies under consideration. Another specific element is the addition of additional and differentiated features within the product ranges for the purpose of making such products into distinctive and more appealing merchandises for the customers.
Buyers' Power
The buyers are the purchasers of the manufactured mobile phone sets and they generally adhere to the preferred features and are as well sensitive to the price structures. In each of the regional markets, all of the companies provide at least two products and this is considered to be an incentive for the buyers to purchase. This realisation is a specific indication of the power of the buyers to compel the companies to either add or remove any product feature.
Suppliers' Power
The corporate social responsibility based elements and the community development based considerations provide the basis on which the power of the suppliers and their ratings could be formulated. The suppliers generally vary their price extents for different components of the mobile phones. The cost is generally high when any company such as the Red Zone could have to switch from one to the other supplier. Backward integration of processes and services could be considered by such companies such as the Red Zone for the purpose of cost reduction and this could entail a significant threat for the suppliers who could have low ratings.
Threat of New Entry
The mobile manufacturing industry is a difficult realm for other companies to establish themselves. The barriers include large amounts of investments of resources and moving the organisational assets to the targeted regions of the market. Apart from these, the variable costs and utility charges as well as expenditure to sustain qualitative labour are considerably high.
Substitute Products
The substitute products of the mobile phones could be comprehended as tablet computers which could combine the mobility of the hand phone and the features of voice calls as well. However, it is more likely that such transition could take place where the interested customers could switch over from one phone set to another if affordable prices are available. European customers have the options of selecting any handset from the available different Tech products. This could enhance the substitute product related threats within the targeted market regions.
PEST Analysis


Competitors Analysis
Out of the seven competing companies in the current market segment, Red Zone has two close competitors and these are Blue Dragon and Moews in terms of market share possession and profit margin obtainment. The product offerings of the Blue Dragon comprise of 20.70% of the market share and are similar to that of the Red Zone comprising of tech 1,2 and 3. The regional distribution of such products of Blue Dragon could be ascertained to be similar with that of Red Zone with one exception of Europe where the offering of Tech 2 is substituted by Tech 1. The product offering of Moews is also comprised off by Tech 1, Tech 2 & Tech 4 and the total share of market could be identified as 16.80% with different regional distribution of the products. Tech 2 is offered by Moews at all three market regions and Tech 3 is offered by the company at only USA and Europe. The production of Tech 4 is going at full pace by the company which is a matter of concern for the Red zone since the company under consideration could decide upon to commence the production of Tech 4 based products as an additional product line to the existing product offering inventory. Grey could be identified to be a close competitor in the financial performance domain including the revenue earned from sales and the profit margin which is left after taxation could be completed. The considerable market share of 16% of Grey with only the Tech 2 and Tech 4 product offerings is significant in this respect. Grey has been providing the Tech 4 at the dual regions of USA and Europe and Tech 2 product at all of the three market regions.

Competitive Scenario
Resource Measures of Red Zone
Red Zone holds 12 production plants at the United States with utilisation of capacity at 60% and there are 5 production plants in Asia as well with utilisation of capacity at 92% (see appendix 7). The promotion expenditure of Red Zone is $190 million which is the highest in the industry. This has been a fact despite the relatively less expenditure of the company in R&D ($55 million). This has been much lesser than the industrial average of $172 million. The industrial average of profit for the previous financial round ($544 million) has been surpassed by the achievement of Red Zone in the figure of $985 million. Red Zone has achieved the second greatest profit for the previous year and is preceded by Grey.
Distinctive Competencies
Red Zone has the most extensive product offering extent involving Tech 1, Tech 2 & Tech 3 and the regions of sales also involve USA, Europe and Asia. The earning of profit is extensive and consistent regarding the high price structure. The extra price amount is generally justified through addition of special features.


Capabilities
Low cost of production in comparison to market rivals.
Maintaining logistics costs at par with the industrial average (Please referrer to Appendix 8)
VRIO


Competitive Advantage
In spite of the fact that the price model endorsed by the Red Zone is primarily higher, the profit margin of $ 985 million is greater than that of the average of the industry ($544 million) as a whole and in terms of the existing competition, the company stands at the second position regarding gross profit margin.
The lower production costs and relatively high prices of the Red Zone have contributed to the comparative increment in the margin of profit of the company.
The company expends large sums of money ($190 million) which could be above the average rate of the industry which has been $57 million.

Critical Analysis - Investments in R&D
The importance of crucial involvement of the Research and Development processes and the associated investments could not be overstated. This is congruent with the organisational efforts to enhance the aspects of value of profit and market share possession so as to gain beneficial competitive advantage on the competition. The objectives of development of products and the improvement in the innovation criteria on the product inventory are related to the organisational objective to develop product differentiation for the purpose of gaining competitive advantage. The process of research and development is also meant to develop new technologies so that technical superiority over the competitors could be maintained (Parcharidis & Varsakelis, n.d.). In this respect, it could be understood that the operations of a company such as the Red Zone, is primarily influenced by R&D in the form of development of information and knowledge to better design, develop and increase the efficiency of the products and services of the organisations under consideration. The different segments of the strategies and plans of any business organisation are consistently connected through the research and development processes and this process involves the elements of marketing and management of costs (Ross, 2018). Various strategies and technologies are adopted by organisations such as the Red Zone so that the products and services of theirs could not become imitable through their competitors. Apart from these, the R&D functioning could extend to the various business processes such as reduction of the marginal costs and increment of the marginal productivity and these functioning could lead to the enhancement of competitive abilities over the nearest market rivals (Ross, 2018).

The purpose of research could be determined to be the fulfilment of the necessity to assess the preferences of customers and demands of consumers regarding the services and products. This process is also vital in providing accurate information to the companies to outline any existing or potential opportunity within the existing market. Research is critical in terms of introducing new products and services within the existing market scenario since this could determine the prospect of success or failure in terms of identification and preparing for any eventuality which any such business organisation such as Red Zone could experience (Ross, 2018). Avoidance to the investments in R&D could be a precarious decision since innovative capability maintenance could be only successful through sustained investment in R&D processes. Backward integration process based technology acquisition could be on sustained for the long terms. Contrary to the prevailing perceptions, innovation is not the forte of the entrepreneurial small ventures and it is primarily generated by the large organisations (Knott, 2018). The large organisations persistently invest in greater R&D and this is why the research quotient is higher in terms of innovation. As per the research of Knott (2018), companies which have in excess of 500 employees invest at least 5.75 times greater in R&D in comparison to the smaller organisations and the outcome of such investments is 13% greater productive since only 25% of the start up organisations with venture capital investments could ever recover their initial investments.
Recommendations
Functional Level Strategies
Marketing Strategy
Allocation of greatest amount of budgetary resource ($190 million) for the purpose of promotional activity.
Undertaking of introducing the tech 4 to cater to growing network coverage at Europe by the next year.
Recommended greater investment in the R&D for the introduction of Tech 4 product and addition of greater features.
Operations Strategy
Increment of the numbers of the production plants at Asia within the next 3 years
Utilisation of 75-80% of the capacities of the plants at USA.
Finance Strategy
Equally focused capital investment structure and balanced debt to equity ratio.
The amount of R&D budget ($55million) is comparatively lower than that of the competitor Blue Dragon (S355 million). Thus allocation of 5 to 10% of sales revenue for the budget of research and development for the Tech 4 introduction is recommended.
Necessity to obtain greater retained earnings at par with the industrial average of $ 1.5 billion.
Business Level Strategy
Differentiation Strategy
The introduction of the Tech 4 based products could be assisted through adoption of an effective differentiation strategy by Red Zone. Addition of newer features could be also assistive in this context for the regions of Europe and USA. Previous product features would have to be surpassed and this process could be made possible from the experience of investments in the research and development process. Tech 4 products, furthermore, would have to be tailored in such a manner that a price tag could be maintained which would be marginally higher than those of the closest market competitors of Red Zone.
Corporate Level Strategies
Necessity to enhance the outsourcing of the productions to Asia and increment of the production plants in the next 3 year period.
Addition of new features to the Tech 1, Tech 2 and Tech 3 products to revive the same from the effects of the maturity phase. Introduction of Tech 4 products. Assessing of market demands more effectively and comprehensive marketing plan formulation through increased R&D.
Analysis of Stakeholders


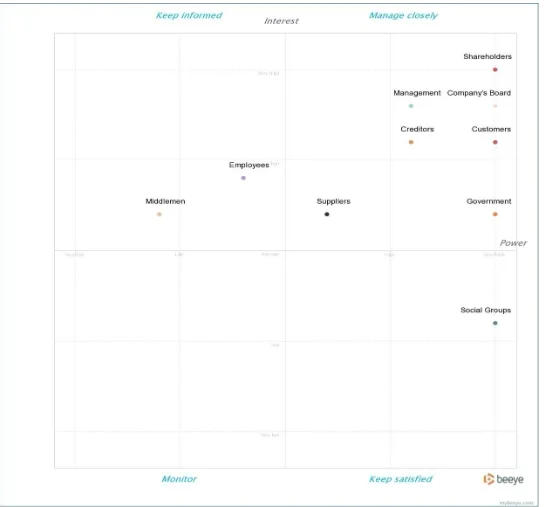
Stakeholders Map - Mendelow's Matrix


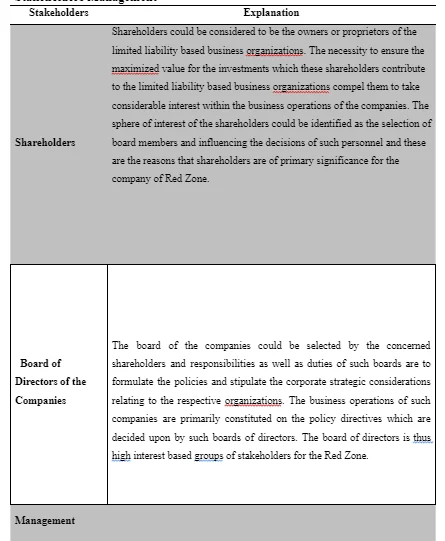
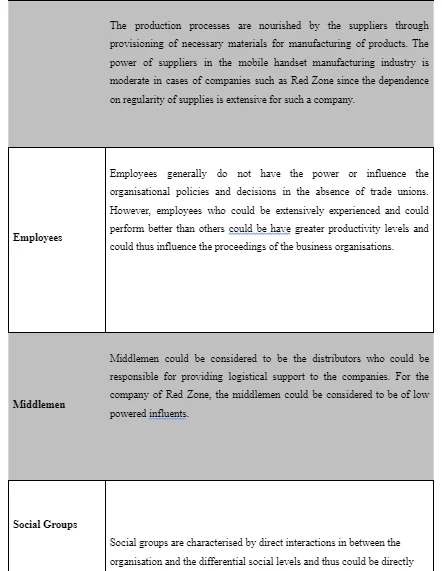
Stakeholders Management


Strategy for Communicating with stakeholders

Reference List
Riding, A., Orser, B. & Chamberlin, T. (2012) Investing in R&D: Small and Medium Sized Enterprise Financing Preferences. Venture Capital: An International Journal of Entrepreneurial Finance. 14 (2-3). p. 199-214.
- 24/7 Customer Support
- 100% Customer Satisfaction
- No Privacy Violation
- Quick Services
- Subject Experts


