Resistance And Resistivity
Introduction
The experiment focused on investigating the resistance and resistivity of putty on various lengths and cross-sectional pieces. Resistance was measured by measuring the voltage and current passing through the putty.
Resistance
Resistance is the measure of opposition to the flow of an electric current passing through an object. It is a ratio of the voltage applied on an electric current flowing on an object.
It is possible to predict the behaviour of a material using the Ohm’s law (states that the current passing between two points and the voltage across the points are directly proportional) if, within a range of voltage, the resistance is constant.

The electrical resistance works similarly to the concept of mechanical friction; resistance is dependent on the material of an object. Electrical insulators will have a low conductivity and therefore a high resistance. Electrical conductors, on the other hand, have a high conductivity and therefore a low resistance.
Resistance in a conductor is affected by the capacity of electrons to flow through a conductor (Mu et al., 2016). In shorter distances, the electrons travel and a shorter distance, and since the collisions are fewer, more energy is conserved thus allowing higher current (Wenzel et al., 2016). With a wider cross-sectional area, electrons are allowed to move faster which also allows a higher current. This theory can be explained using the flow of water in a pipe; in a wider pipe, the water moves faster and with minimal resistance, similar to principles applied in engineering dissertation help (Schricker et al., 2013). In a thin pipe, the water flows with more resistance and slowly. The same can be explained about a short and a longer pipe.
Resistivity
The material dependence of resistance is quantified using resistivity. The resistance of a material depends on the material and shape/size of a material; resistance is greater for a longer object and less for an object with a large cross-sectional area.
The resistivity of a material is thus the resistance to the flow if current. It is a measure of how strongly the material of an object can oppose the flow of current. Resistivity is also referred to as the "specific electrical resistance". It is the factor that allows comparison of resistance of different conductors subject to a specific temperature and conductor's physical properties irrespective of the cross-sectional area and length. Resistivity is calculated as;
A high resistivity indicates high resistance and low resistivity indicates low resistance. Materials with low resistivity allow the current to flow through easily; they are good conductors of electricity. The resistivity of material, therefore, affects its resistance besides other factors such as length, temperature and cross-sectional area.
The aim of this experiment is to investigate the factors that affect the resistance and resistivity of a putty. The two factors investigated are length and cross-section area to determine how they affect the resistance and resistivity of a putty. The hypothesis adopted is that the longer the length and the wider the cross section area, the greater the resistance and resistivity. The rationale for the hypothesis is that the longer and the wider the putty, the more atoms the electrons will collide with and therefore the greater the resistance.
The apparatus used for the experiment were;
Play-Doh
Callipers
4 nails rad2deg
DC power supply
2 multimeters
The experiment was done in two-step; length dependence and cross-sectional area dependence. The two variables were adjusted to read different levels of current and voltage, and the experiment on both variables was conducted twice to get average measures. To investigate the length dependence impact on putty resistance, two nails were used to mark the length being investigated. The putty was 24cm long and 3.5cm in diameter. Length and diameter were recorded to the nearest 0.1cm, the voltage to the nearest 0.01V and current to the nearest 0.01mA. First, the nails were put an end to end 18cm apart. Then with a lead running from one of the nails to the COM terminal of one multimeter and another lead running from the other nail to the V terminal of the second multimeter, the dial for both of the multimeter was turned on. After turning on the power supply, the Voltage Adjust knob was turned from zero until the multimeter read 20mA. Measures of the length, voltage and the current were taken. By adjusting the position of one of the nails in intervals of 2cm, 7 measures were taken consisting of lengths 18cm, 16cm, 14cm, 12cm, 10cm, 8cm and 6cm. A second reading repeating all the steps was done for similar lengths was made.
In the cross-sectional area dependence experiment, the putty was reshaped into a cylinder to a diameter of 3.5cm. By repeating the above process by reducing the diameter using the two nails in intervals of 0.5cm so that measures of diameter, current and voltage were taken. 5 measures were taken consisting of diameters 3.5cm, 3cm, 2.5cm, 2cm and 1.5cm. a second reading for all these diameters was done.
Results
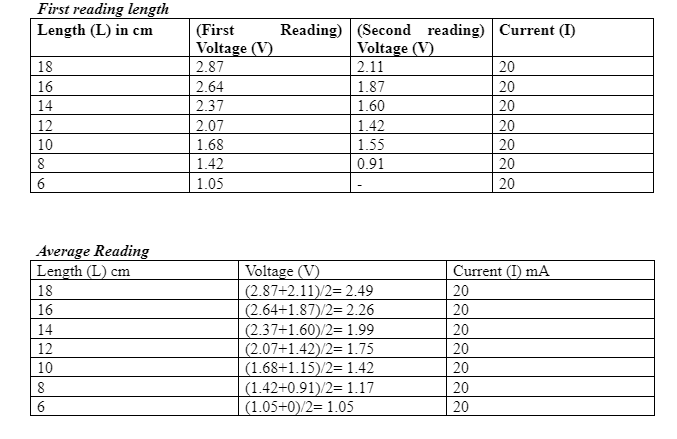
This section presents the findings in tables and graphs for this experiment. Since 2 readings were done for each variable, the measures were averaged. The following table shows the reading for the length.

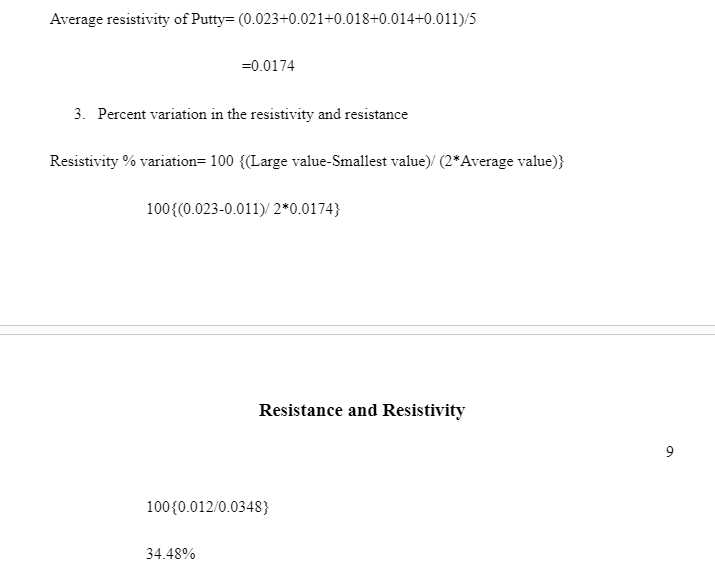
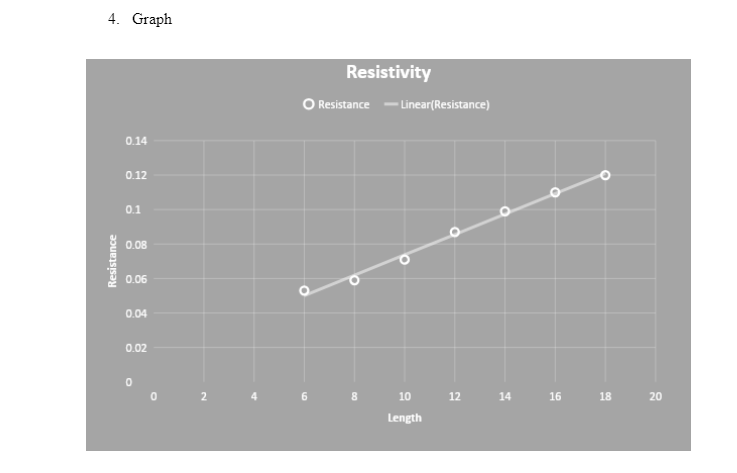
The average resistivity is 0.0174 and lower than the slope multiplied by the average cross-sectional area (0.0384). The resistivity measures the electrical resistance per unit, a cross-sectional area unit, and a length unit (Liu et al., 2016). The slope is the ratio of vertical change to the horizontal change between two variables. In this case, the slope 0.0059 shows that for a unit change in length, a 0.0059 resistance is experienced.


Discussion
From the above results, a directly proportionate relationship between the resistance of putty and length was identified. This means that the longer the distance between the nails the greater the resistance. This finding agrees with the hypothesis of the experiment. The reason provided for why a longer putty has a greater resistance is that the electrons encounter more atoms in a longer putty and therefore the greater the resistance (Kurs and Kesler, WiTricity Corp, 2012). The slope of this inverse graph is 0.0059 indicating a gentler slope. This gentle slope is an indication that the force that is accelerating the electrons in the putty is low. Resultantly, fewer electrons are allowed to pass through a cross-section for a longer putt and therefore the current passing through a longer distance is less than that passing through a shorter distance (Li, Ameri and Cardiac Pacemaker, 2012).
A similar direct proportionate relationship was identified between length and resistivity; the longer the length/high resistance, the higher the resistivity. Resistivity represents the resistance per length unit and cross-sectional area. A direct proportionate relationship between the length and the resistivity explains that as the length of a material is increased, the flow of an electric current is slower.
The second section of the experiment shows an inverse proportional trend between the cross-sectional areas of putty to resistance. This indicates that the thicker the putty, the lesser the resistance. The reason for this observation is that in a larger cross-sectional area, the electrons carrying the current have a larger area they flow through and with minimal resistance. Resistivity increases with a decline in the cross-sectional area which indicates a proportionate inverse trend between the diameter of an object and its resistivity because as the cross-sectional area increases, the flow of electric current experience a higher resistance from the increased number of electrons.

Conclusion
The experiment shows two findings that; the resistance of putty is directly proportional to its length meaning that as the length of the putty increases, the resistance increases and therefore the short a putty is the less resistance. Resistivity, which represents the resistance also per unit length also relates directly proportionately with the length of a putty. Secondly, resistance is inversely proportional to the cross-section of putty which means that as the cross-sectional area increases, resistance decreases and therefore as the cross-sectional area decreases, resistance increases. Finally, the experiment shows that a longer and thinner putty will have higher resistance while a shorter and thicker putty will have a lesser resistance.
Take a deeper dive into https://www.dissertationhomework.com/samples/assignment-essay-samples/education/reserch-informed-practitioners with our additional resources.
References
- Kurs, A.B. and Kesler, M.P., WiTricity Corp, 2012. Low resistance electrical conductor. U.S. Patent Application 13/222,915.
- Li, Y. and Ameri, M., Cardiac Pacemakers Inc., 2012. Leads with high surface resistance. U.S. Patent 8,275,464.
- Liu, Z., Shi, T., Tang, Z., Sun, B. and Liao, G., 2016. Using a low-temperature carbon electrode for preparing hole-conductor-free perovskite heterojunction solar cells under high relative humidity. Nanoscale, 8(13), pp.7017-7023.
- Mu, J., Hou, C., Wang, G., Wang, X., Zhang, Q., Li, Y., Wang, H. and Zhu, M., 2016. An elastic transparent conductor based on hierarchically wrinkled reduced graphene oxide for artificial muscles and sensors. Advanced Materials, 28(43), pp.9491-9497.
- Schricker, A., Clark, M. and Herner, B., SanDisk 3D LLC, 2013. Memory cell that employs a selectively fabricated carbon Nano-tube reversible resistance-switching element formed over a bottom conductor and methods of forming the same. U.S. Patent 8,558,220.
- Wenzel, S., Randau, S., Leichtweiß, T., Weber, D.A., Sann, J., Zeier, W.G. and Janek, J., 2016. Direct observation of the interfacial instability of the fast ionic conductor Li10GeP2S12 at the lithium metal anode. Chemistry of Materials, 28(7), pp.2400-2407.


- 24/7 Customer Support
- 100% Customer Satisfaction
- No Privacy Violation
- Quick Services
- Subject Experts