Trends in University Population Growth
Question 1
According to the analysis, there is a positive correlation between the population and time (in years). Meaning that the university population has been increasing steadily over the years in all the two countries; this is an indicator that the educational reforms in Scotland (control group), and England (Targeted group) did not affect university population. In the second table it also clear that the number of applications is positively correlated with time (years) and country. Meaning that from 2001 both England and Scotland have been receiving high number of university applications despite the difference in educational tariffs.
The standard error between the population coefficient and time (years) is 50.343. Such a huge standard error is expected since the data was collected only for a period of 2008 to 2015 (7 years) in instances where this data could have been collected for a longer period for example 15 years, it is expected that the standard error will reduce.

YearD = a dummy variable that ranges from 0-1 where zero stands for the period before 2012 (when education reforms was conducted), while 1 represents the period from 2012 to 2015 (aftermath of the policy). Diagrammatically, it can be represented as;

CountryD = a dummy variable that gives numerical denotations to countries. In this instance 0= Scotland, while 1= England.

Question 2
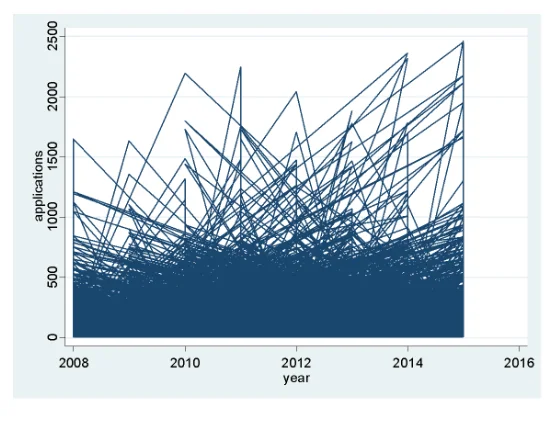
From the graph it is evident that the number of applications started to drop in the period between 2010 and 2011, and the situation was worse in 2012. However, after that, the number of applications has been gradually rising. The DD calculation in part one made an assumption that as time moves (years), the number of applicants are also increasing. It failed to consider the decline in university applicants between 2010 and 2012. More so, the DD calculation in the first part made an assumption that the education tariffs introduced in 2012 in England did not have any effect in the number of university applicants.

Question 3
As stated above, for the sake of running a linear progression, both countries had to be given a numerical connotation which is 0 for Scotland and 1 for England. Using the command collapse(sum) applications, by(countryD), where CountryD stands for a dummy variable that shows the respective numerical values of Scotland and England. The results were as follows
countryD applications
0 1111580
1 12582390
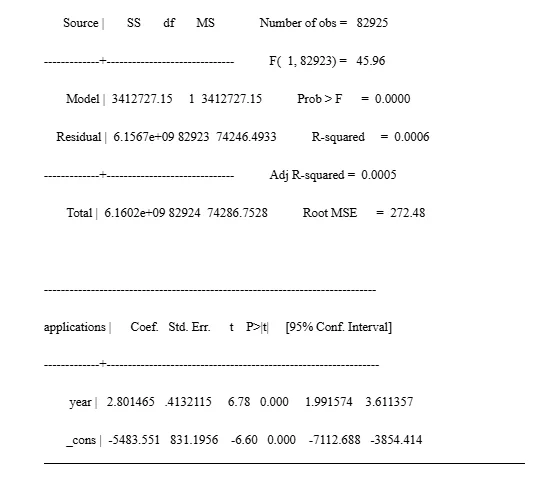
This means that England had a more university applicants than Scotland. In regression the results were as follows for Scotland


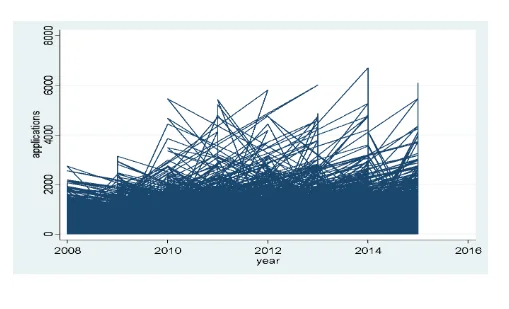
The results show that for every year the number of university applicants in Scotland doubled, while the same can be said about Britain as shown in the result below. From the graphical representation it is evident that in 2012 both countries faced a sharp decline is university applicants which later improved. However, the Scotland has shown a more rapid increase over the years in university applicants than in Britain.
Britain’s regression

Britain Graphical representation

Question 4
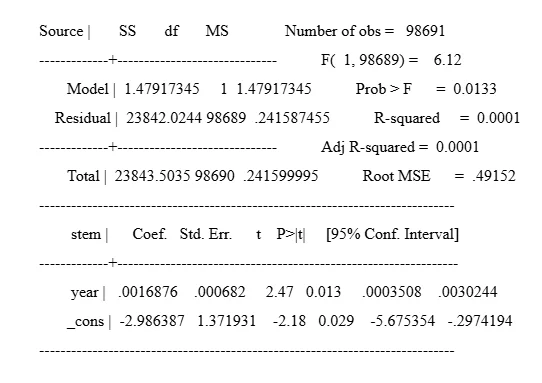
In regards to whether the effects of fee increment, there is a very weak correlation between fee increment and the enrolment in the STEM subjects. As shown in the table below

The same analysis was conducted using YearD (a dummy variable that stands for the period before the tuition fees was introduced and after) and the results remained the same, confirming that the fee increment did not affect the enrolment in the STEM subjects.

Besides in all cases (both using years and yearD), there was a negative correlation between the tuition fee increment and subject selection as shown in the table below meaning that fee increment did not in any way affect subject selection.
Continue your exploration of The University Of Wolverhampton with our related content.

In the case of YearD, the results were


Question 5
As per the data, the mean salary is 19470.28 with a standard error of 14.844, which means that most graduates are being paid higher salaries (1st quartile)

The analysis shows that the effect of the increase in tuition fees on applications depends on the expected salary of graduation. The data also shows that as time went by salary would have increased by 4%. However, after the 2012 tuition fees increment (as shown in the yearD analysis), salaries increased by 8%.

reg yearD salary

- 24/7 Customer Support
- 100% Customer Satisfaction
- No Privacy Violation
- Quick Services
- Subject Experts


