BNM PLC Profitability Ratios Analysis
Part 1: Business Performance Analysis
Statement of Profit and Loss
In order to analyse the statement of profit and loss various profitability ratios has been maesaured which are discussed below.
Gross profit margin
Gross profit margin is important profitability ratio which evaluates the effectiveness of the company in selling the stocks and merchandise (Peterson &Fabozzi, 2009). The following table demonstrates the gross profit margin for the company.
From the above table it can be observed that the gross profit margin of the company was 24.76% in 2017 which has increased to 23.68%in 2018. This indicates that the company has sufficient profit to pay off the operational expenses, but its profitability in selling the inventory has reduced in recent times.

Net profit margin
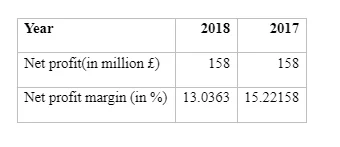
Net profit margin is also termed as return on sales ratio which help to understand the proportion of revenue which are left after paying the cost of goods sold and other direct expenses of business (Peterson &Fabozzi, 2009). The following table demonstrates the net profit margin for BNM PLC for 2017 and 2018.

From the above table it can be observed that the net profit margin of the company was 15.22% in 2017 which has reduced to 13.03% in 2018. This indicates that the company is able to transform 13% of its revenue into net profit. Furthermore, the company’s ability to manage the expenses has reduced from 2017 to 2018 and therefore it requires to maintain budget and cut off more operational expenses to earn higher profit.
Return on Assets (ROA)
Continue your journey with our comprehensive guide to SEGRO plc: Leading Urban Warehousing.
ROA is a profitability measurement which evaluates the net profit generated by total assets throughout a period of time. It helps to understand how effectively a company can manage the assets to generate net profit(Peterson &Fabozzi, 2009). The following table demonstrates the ROA of BNM PLC from 2017 to2018.

From the above table, it can be observed that the ROA of BNM PLC was 9.3% in 2017, which has reduced to 7.56% in 2018. This indicates that with £100 that BNM invested in assets, it can generate net profit of about £7.56. It is quite low depending on the economy. Furthermore, it can also be stated that the capability of the company to efficiently use the investment in assets has reduced.
Return on Employed Capital (ROCE)
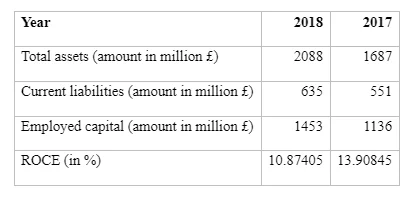
ROCE help to evaluate how effectively an organisation can earn profit through the employed capital. This ratio demonstrates how efficiently the assets of the company is performing(Peterson &Fabozzi, 2009). The following table demonstrates the ROCE of BNM PLC in 2017 and 2018.

From the above table, it can be observed that the ROCE of BNM PLC was 13.9% in 2017 which has reduced to 10.87%. This specifies that with£100 invested in capital, the company earns about £10 net profit. Furthermore, it can also be stated that the company’s effectiveness in using the capital and long run assets has decreased in recent times.
Continue your journey with our comprehensive guide to SEGRO plc.
Dig deeper into Financial Ratios in Construction Analysis with our selection of articles.
Return on Equity (ROE)
ROE helps to measure the capability of an organisation to generate profit from the investors’ investment. It is an indicator of efficiency of management at utilising equity financing to fund the functions(Peterson &Fabozzi, 2009). The following table demonstrates the ROE of BNM PLC for 2017 and 2018.

From the above figure, it can be observed that the ROE of the company was 18.78% in 2017 which has reduced to 16.05% in 2018. This indicates that every pound of common shareholder’s equity earn about net profit of £0.16. In other words, the shareholders of the company enjoys 16.05% return on investment. Therefore, from the table it can be observed that although it is a healthy return, the efficiency of utilising the shareholder’s fund has reduced in 2018 than 2017.
Statement of Financial Position
To analyse the financial position of the business, the liquidity position and solvency position has been evaluated through different ratios.

Quick ratio
Quick ratio is also termed as acid test ratio which evaluates the capability of the company to pay the current dues (Baker &Powell, 2009). Following is the quick ratio of BNM PLC in the year 2017 and 2018.

From the above table, it can be observed that the quick ratio of the company was 0.22 in the year 2017 which has increased to 0.33 in the year 2018. This indicates that the company has 0.33 times more quick assets than the current liabilities and therefore it can pay the current dues without selling the long run assets. The table further states that the liquidity position of the company has enhanced in 2018.
Current ratio
Current ratio is an efficiency ratio which also evaluates organisational capability to pay the short run dues with current assets it has(Baker &Powell, 2009). Following is the current ratio of BNMPLC in the year 2017 and 2018.

From the above table it can be observed that the current ration of the company was 2.97 in 2017 which has become 3.18 in 2018. This specifies that the company has 3.18 times more current assets than current liabilities. Therefore, the company can easily pay the current liabilities. This further specifies that the company is highly liquid and is gaining money and also it has strong ability to collect the debts or receivables.
Interest coverage ratio
Interest coverage ratio evaluates the percentage of income which can be utilised in order to pay the interest expenses. It is an important measurement of solvency (Baker &Powell, 2009). Following is the interest coverage ratio of BNM PLC in the year 2017 and 2018.

From the above table, it can be observed that the interest coverage ratio of the company was 23.22 in the year 2017 which has reduced to 14.2 in the year 2018. This indicates that the organisation has revenue which is 14.2 times more than the interest expenses. Therefore, the company is less risky towards solvency. However, its solvency ability has reduced and interest coverage ratio is decreased in recent times and that specifies that its credit risks has increases.
Debt to equity ratio
Dent to equity ratio is important measurement of analysing the financial position of a company. It evaluates how much debt the company has in contrast to the equity(Baker &Powell, 2009). The following table demonstrates the debt to equity ratio of BNM PLC in 2017 and 2018.

From the above table, it can be observed that the debt to equity ratio of the company was 1 in the year 2017 which has increased to 1.12 in the year 2018. This indicates that the company has 1.12 times more liabilities in comparison with the equity. Therefore, it can be stated that majority of the company assets are owed by the creditors than the investors. Since its debt to equity ratio has increased, it can be stated that the company’s risk has increased as the company is using debt financing rather than equity financing in order to fund the business. This debt will require to be paid and certain amount of regular interest must be paid to the creditors of the company.
Debt ratio
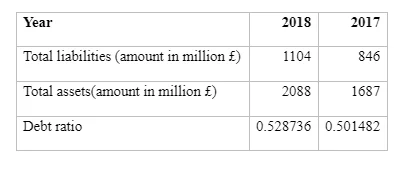
Debt ratio evaluates the financial leverage of the company which is demonstrated in the following table.

From the above table it can be observed that the debt ratio of the company was 0.50 in the year 2017 which has increased to 0.52 in 2018. This indicates that the company has 1.92 times more assets than the liabilities. In other words, the organisational liabilities are 52% of the total assets. Essentially the creditors owns more than half of the organisational assets and the investors owns the rest. Therefore, it can be stated that it is a highly leveraged company and is becoming less stable since its debt ratio has increased.
Statement of Cash Flow
Cash ratio
Cash ratio evaluates the cash flow and the liquidity position of the company. It evaluates organisational ability to pay the current dues with only cash (Gibson, 2012). Following is the cash ratio of BNM PLC in 2017 and 2018.

On the basis of the above table, it can be observed that the cash ratio of the company was 9.2% in the year 2017 which has increased to about 20.31% in the year 2018. This indicates that the organisation has sufficient cash to pay off only 20.3% of its current liabilities. This is quite low ratio which means the company maintains low cash balance, but it has increased in recent times.
Free Cash Flow (FCF)
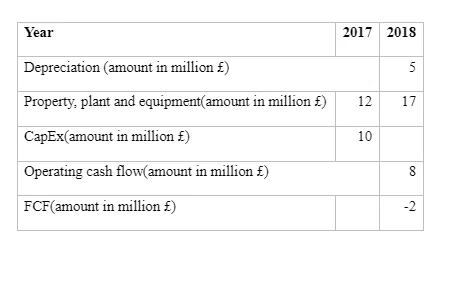
FCF is efficiency ratio which computes the level of cash a company can make and utilises to operate the business. It demonstrates the additional money of a company generates after paying the operational expenditures and capital expenditures (CapEx)(Gibson, 2012). Following is the FCF of BNM PLC in 2018.

From the above table it can be observed that the cash flow is less than the capital expenditures of the company. Therefore, it can be stated that the company is unable to use cash flow to give shareholders more rerun or invest the money back in the business. Hence, the company is not much efficient in generating additional cash from the business.
Segmental Analysis
Segmental analysis is one of the important tools that are used to mitigate the developing problems. The analysis offers information to its investors along with creditors for making effective decision. The analysis is vital to create transparency along with ensure potential investors with vital information that leads to sustainability. The BNM plc operates across various geographical regions including Scotland, Wales and England. It is determined from the table that overall gross profit increased from the year 2017 to 2018. However, in the geographical area of Wales the profit reduced due to several aspects. Moreover, the operating profit also increased from £209m to £213m in the year 2018. The increase in operating profit implies that the performance of the company is augmenting. This reflects that BNM business is becoming more profitable due to the positive external factors and strong administration. This analysis is based upon the different business segments. On the other hand, considering the ratios to determine the efficiency it is noted that gross margin has reduced from 24.8% to 23.7% in the year 2018. This financial metrics reflects that the financial position of the company is good and the sales are increasing. The gross profit ratio determines that BNM has the ability to spent money to attain better revenue. As per the ratio the future operation of the business is effecting in terms of maintaining costs and implementing changes. As per the analysis of the segments and ratio it is noted that the company is meeting the industry standards by augmenting sales and reducing costs. However, based upon the analysis the net margin reduced from 20.1% in the year 2017 to 17.6% in 2018. This implies that the company efficiency reduced since 2017 due to the increase in the costs. Thus to increase the net margin the intention of the company is to reduce the costs and convert sales. Net profit margin fundamentally states the profitability of the business and its effectiveness. The lending decisions are being made based upon the analysis as it has a direct impact over the reserves that help to maintain the business. As the net profit margin is reducing the BNM plc needs to reduce the overheads costs and increase its sales volumes across different regions of Wales, England and Scotland.
Part 2: Investment Appraisal
Investment appraisal method is implemented in the business to allocate the resources along with expenses effectively so that risk involved in the investments is evaluated based upon the term of the project. For the success of the business the main aspect is to determine the valuable options and make decisions. The challenge is to identify along with collect information before the investment decision.
Management Forecast
The management forecast is based upon the investment appraisal techniques so that the capital decision is effective. The management needs to forecast about the performances based upon the sum involved for analysing the future benefit. The forecasting is determined through the help of the gathered data in the table below:

From the data it can be stated that management is forecasting growth with the initial investment of £500m in the year 2017. The revenue is increasing slowly with increasing cost of variable. This is impacting the contribution level and the business potential. The contribution increases with increasing years as per the evaluation of the Wales market.
Investment Appraisal Techniques
The investment appraisals techniques are vital to determine the business growth based upon the amount of money spend by evaluating benefits with the costs. The growth and employment is determined using several appraisal methods.
Payback Period
The payback period signifies the year required to retrieve back the initial investment through operating cash flow. From the gathered data it is analysed that the payback period is about 4years 6months. This investment technique is used for analysis as it is simple and helps to improve the accounting rate of return. The payback is 4years thus the possibility of obsolescence is less. This method is used by the business to evaluate the risk and make effective management decision for growth.
Accounting Rate of Return
ARR is implemented by BNM plc to measure the profitability of the business and book value of assets. From the evaluation of the data it is determined that the BNM plc targets ARR to be 5%. From the calculation it is analysed that the annual profit is £15.2m and asset value is £250m. If the ARR is more it is better for the company and its prospects. In this case the ARR of the BNM Plc is 6% which implies that the company is in a better position. This technique uses historical data and estimated values thus the results might be vague (Hamad, 2013). However, the calculation is based upon profits thus impacting its relevance. 6% ARR is higher than the target this implies that the attractiveness of the business is huge as the ARR is more. This technique is effective as it does not consider the cash flow or time value thus influencing the decision to expand.
Net Present Value
This is one of the most effective capital budgeting decision making techniques that is used to determine the wealth and prospective of investments. This technique is effective because time value of money is considered which makes it useful for future expansion of the business. The analysis is based upon the cash flow and considering the discounted factors for analysing the risks. The NPV in this case is positive and is 22 which imply the BNM is in a position to expand. The present value is improving with time but is less than the cash flow as depicted in the table below:


However, the discounting factor impacts the present value inversely and is effective to make comparisons (Hamad, 2013). Risks in the business environment are high but NPV reduces the risk and helps to make effective decisions as the time value concept is considered.
Source of Finance
BNM plc is planning to expand its venture in Germany with a fund of £400m so that the business can attain success and meet the needs. There are several sources of funds which include debt, equity, term loans, retained earnings and more. In this case, BNM plc can use debt financing to expand its projects in order to attain high rate of return. There are several advantages of using debt financing and one of the most effective aspects is tax advantage. The amount that is paid as interest is tax deductible which implies that the net obligation is reduced. The amount that is retained is managed by the company the lender has no relationship in terms of making decisions. Thus making the process of planning easier which is about expanding in Germany. The predictability is easier thus the management of cash flow is effective making the business successful. However, there are few drawbacks which includes that the company requires good credit rating for debt financing (Pandey, 1995). The business assets are under potential risk when the sourcing is done through the use of debt. The second form of financing that BNM plc might consider is the equity financing which is about attaining funds from investors. This form of sourcing is less riskier as the monthly loan payments is not there and this fund is useful for expanding business even without positive flow of cash. Another reason that BNM might use this funding is because even if the company faces credit problem this funding augments finance growth. The funding through equity is based upon long term planning this implies that investors of the funds does not expect to have immediate return (Cremades, 2016). The investors have long term consideration before sourcing the fund. On the other hand the drawback is that in this financing investors expect return and tend to become the partner in the process of decision making. The investors have their voice as they are sourcing fund thus impacting the business movements. The chances of conflicts arise due to differences in opinion and style. However, these two forms of sourcing is effective for BNM plc to expand its business and attain profitability in the long term.
Non Financial Factors
There are several factors that the board of directors need to focus upon before expanding the business in Germany which includes understanding and meeting the current along with future legal factors. It is vital that BNM meets the standards of the industry and considers good business practices to ensure sustainability along with profitability. For the success of BNM in Germany the business needs to recruit talents and improve the morale so that the expansion yields profit and growth. The board needs to improve its relationships with the suppliers and customers to ensure sustainability and growth. The board is advised to strengthen its management policies and skills so that the business capabilities are augmented in Germany. Before the expansion it is vital and advised that the board analyses the market and evaluates the threats that is faced by BNM plc in the new potential market of Germany. Furthermore, the company needs to determine the political stability and the economic factors before the process of expansion so that BNM plc can attain success. The boards of directors are advised to consider upon the demographic characteristics, competence and values so that the networking with the Germany government is effective leading to greater sustainability. BNM plc is a well known in Germany therefore the intention of the board is to improve its reputation in the local market and community by maintaining environment as this acts as an aspect for potential investment.
References
- Baker, H. K.&Powell, G., 2009. Understanding Financial Management: A Practical Guide.John Wiley & Sons.
- Cremades, A., 2016. The Art of Startup Fundraising: Pitching Investors, Negotiating the Deal, and Everything Else Entrepreneurs Need to Know. John Wiley & Sons.
- Gibson, C. H., 2012. Financial Reporting and Analysis.Cengage Learning.
- Hamad, Y.S., 2013. Financial analysis and management. School of Commerce, pp. 1-21.
- Peterson, P. P.&Fabozzi,F. J., 2009. Analysis of Financial Statements.John Wiley & Sons.
- Pandey, I.M., 1995. Finance: A Management Guide. PHI Learning Pvt. Ltd.
- 24/7 Customer Support
- 100% Customer Satisfaction
- No Privacy Violation
- Quick Services
- Subject Experts


