Testing Anomie’s Impact on Suicide Rates
Question 1
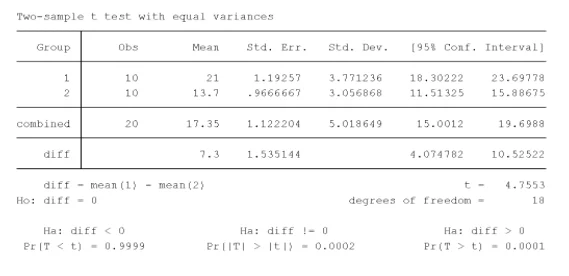
Null Hypothesis: High-anomie metropolitan areas do not have higher suicide rates than low-anomie areas. Alternative Hypothesis: High-anomie metropolitan areas have higher suicide rates than low-anomie areas.
It is a one-tailed test as a researcher is interested to know whether High-anomie metropolitan areas have higher suicide rates than low-anomie areas.
Independent t-test will be used as there are two independent variables with one continuous dependent variable.
For the 95% confidence interval, that is, 0.05 alpha level, the critical value for the test statistic is 1.96.

As per independent t-test, t(18) = 4.75; p = 0.0001
The null hypothesis gets rejected.
It indicates that High-anomie metropolitan areas have higher suicide rates than low-anomie areas.
No. Because at 99 per cent CI also there is a statistically significant difference.
Question 2
Null Hypothesis: The relative frequency of attendees who passed the final exam is the same as the relative frequency of non-attendees who passed the exam
For the 95% confidence interval, that is, 0.05 alpha level, the critical value for the test statistic is 1.96.
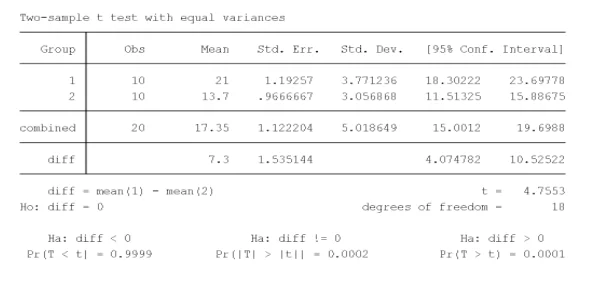

The Null Hypothesis is rejected. It means, the relative frequency of attendees who passed the final exam is higher than the relative frequency of non-attendees who passed the exam
Question 3
Standard Deviation

Covariance


In the above image, var1 is education in years, and var2 is age at childbirth. Thus, the slope comes out to be 0.859. The slope comes out to be positive showing that there is a positive association between education in years and age at childbirth. That is, higher the education, higher will be the age at childbirth and vice-versa. Y=8.789+0.859*X Where Y is age at childbirth and X is education in years. Var1 is education in years, and Var2 is age at child birth
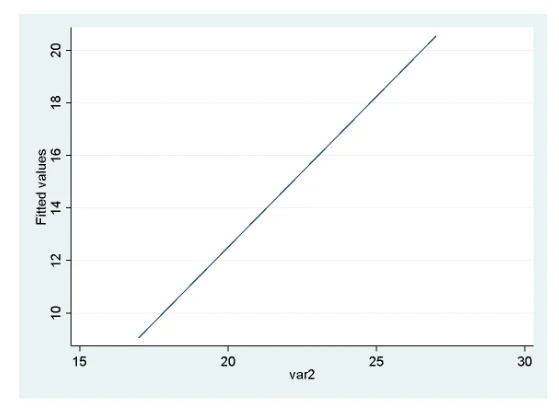
Age=8.789+0.859*22=27.687 Years
Question 4
At 95% CI, gender is not statistically significant. At 95% CI, race/ethnicity is not statistically significant At 95% CI, Socio-economic status is statistically significant At 95% CI, the constant is not statistically significant Depressive Symptoms=2.456+1.570*Gender+1.020*Race or Ethnicity- 0.579*Socio-economic Status
Depressive Symptoms for white women=2.456+1.570=4.026
Depressive Symptoms=2.456+1.020=3.476
White women group is predicted to experience more depressive symptoms.
The r2 from the last model tells that with 100% change in the independent variables, there will be 26.2 per cent change in the dependent variable. At 95% CI, Life Stressors does not have any statistically significant impact on the association between socio-economic status (SES) and Depressive Symptoms as its p-value or the significance value is significant only at 99% CI.
Question 5
ci means babymort
ttest babymort, by(obesehigh)

histogram babymort, frequency

As per the above histogram, the data is positively skewed and is not normally distributed.
The mean level of infant mortality in the state with high obesity is 8.21, and that of low obesity is 6.66. As per independent t-test, t(49) = 3.3860; p = 0.0014 p = 0.0014 At 99.99% CI or 0.0001 alpha levels the null hypothesis can be rejected.
Question 6
ttest lifeexpw, by(metroc)

ttest aids, by(metroc)

Implied independent variable is ‘exercisec’ and implied dependent variable is ‘obeseadultsc’. Null Hypothesis: There is no statistically significant interaction between exercisec and obeseadultsc. Alternative Hypothesis: There is a statistically significant interaction between exercisec and obeseadultsc.
tabulate obeseadultsc exercisec, chi2

As per chi-square test, χ2(4) = 12.9835; p = 0.011. This shows that obesity and physical activity are statistically dependent as p-value is less than the critical alpha value of 0.05.
At alpha = 0.05, obesity and physical activity are statistically dependent as p-value is less than the critical alpha value of 0.05. At alpha = 0.01, obesity and physical activity are not statistically dependent as p-value is more than the critical alpha value of 0.01.
graph twoway lfit exercisec obeseadultsc

There is a strong negative association between obesity and exercise. This relationship is meaningful as lack of exercise will always results in high level of obesity.
As such there is no potential problem of this bivariate association. However, a better result can be obtained by applying Pearson’s Correlation if the variables are continuous and not ordinal or categorical.
Question 7
A.

corr union_perc hypertension mincome

Yes, the findings support the Prof. Smith theoretical model because as per the above correlation, there is a positive association between unionisation and income, that is, higher the unionisation, higher the income. Further, there is a negative association between unionisation and hypertension, that is, higher the unionisation; lower will be hypertension.
graph twoway lfit hypertension union_perc

The line is downward sloping, showing a negative association between unionisation and hypertension.
Question 8
regress violence povertyx
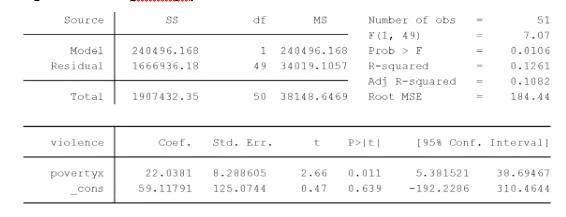
Violence = 59.11791 + 22.0381 * poverty
Null Hypothesis: There is no statistically significant association between povertyx and violence Alternative Hypothesis: There is a statistically significant association between povertyx and violence
graph twoway lfit violence povertyx

As per the regression line, there is a positive association between povertyx and violence. That is, higher the povertyx, higher will be the violence and vice-versa.
For an alpha of 0.05, the slope coefficient is not significant as its p-value is coming out to be 0.639, which is more than the critical alpha value of 0.05. Violence = 59.11791 + 22.0381 * 0.10 = 61.32172 Violence = 59.11791 + 22.0381 * 0.20 = 63.52553

Question 9
corr povertyx obeseadultsx

(r) = 0.52; showing a positive association between povertyx and obeseadultsx
regress obeseadultsx povertyx
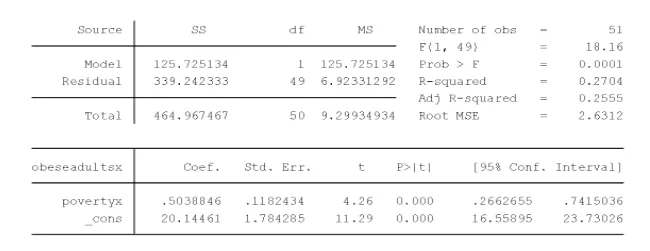
Obeseadultsx = 20.14461 + 0.5038846 * povertyx
The slope coefficient is positive showing an upward slope between povertyx and obeseadultsx. Further, the y-intercept is also positive, showing a positive association between povertyx and obeseadultsx. R2 comes out to be 0.2704, showing that with 100 per cent change in the independent variable, that is, povertyx, a variation of 27.04 per cent can be seen in the dependent variable, that is, obeseadultsx.
Question 10
corr povertyx obeseadultsx collegex

There is a positive correlation between povertyx and obeseadultsx, but negative correlation between povertyx and collegex. Further, obeseadultsx and collegex are negatively associated with each other.
regress obeseadultsx povertyx

Obeseadultsx = 20.14461 + 0.5038846 * povertyx
regress obeseadultsx povertyx collegex

Obeseadultsx = 31.99562 + 0.2458155 * poverty – 0.287168 * collegex
In the first model, there is a positive association between povertyx and obeseadultsx, whereas, in the second mode, povertyx and obeseadultsx are positively correlated, but collegex and obeseadultsx are negatively correlated. The model shows that higher the education, lower will be poverty and adult obesity. Exercise could influence the association between poverty and obesity as a mediator.
- 24/7 Customer Support
- 100% Customer Satisfaction
- No Privacy Violation
- Quick Services
- Subject Experts


