The Dynamics of The Uk Retail Oligopoly
Introduction
Over the last decade, the retail industry in the United Kingdom has been dominated by four big players, which are supermarket chains, namely Tesco, Sainsbury, Asda, and Morrisson. The present report focuses on Sainsbury and Next. Sainsbury PLC is one of the 'the big four' players, whereas Next PLC is a market follower and is a relatively small company compared to the other big players in the retail industry. The retail market is mainly oligopolistic as 75% of the market is shared between Tesco, Sainsbury, Asda, and Morrisson.
Sainsbury Plc
Sainsbury is the second largest supermarket chain of the UK retail industry. The company was founded by John James Sainsbury in 1869. For businesses that are looking to delve deeper into the dynamics of the retail industry, seeking expert guidance, exploring topics such as business dissertation help can provide valuable perspectives. It has 1415 shops all around the globe and is a well-diversified conglomerate. The company opened Sainsbury Bank in a joint venture with Bank of Scotland and also has an agro-business. In 2011 the company opened Sainsbury Energy with British Gas. The company operates through 13 distribution channels. It provides product and services through Sainsbury Online.
Next Plc
Next Plc is a British multinational retailer of clothing, footwear, and home products. The company has almost 700 stores, out of which 500 stores are in the UK and Ireland and rest in Europe, Asia, and the Middle East. The company overtook Mark and Spencer in 2012 and is mainly operated through retail shops, Next directory (website with 3 million active customers), and Next international, which is a global shop. The company has some own brands such as Next sourcing and Lipsy. The company has a large investment to revive stores and marketing.

Industry Analysis and Economic Development
After Brexit, both Sainsbury Plc and Next Plc are experiencing sluggish growth. According to Armstrong (2016), after Brexit, it was forecasted that supermarkets have to increase grocery prices in the course of absorbing higher import costs attributed to a weakened Pound. Additionally, supermarkets are facing fiercely competition. Sainsbury, in particular, experienced plummeting quarterly sales revenue in 2017 as a result of inflation and competition (Rovnick, 2017). Sainsbury was forced to change its pricing strategy to “low prices every day” from special promotional offers, but then also it reported a reduction in pre-tax profits.
Similarly, Next Plc has also hit by the weak pound and shifts from fashion retailers to the growing online transactions (Wood, Z and Agency, 2018). Thus it can be said that Sainsbury is facing fierce competition, while Next is experiencing pressure from fashion business shifting to online. Moreover, both are affected by a weaker pound caused by the Brexit.
The Capital Structure of Sainsbury and Next
The capital structure can be defined as the financing strategy of a firm for its operations, expansion and growth from various sources (Baker & Martin, 2011). A firm can be funded through debt in the form of long-term notes payable or bond issues or equity from preferred stock, common stock and retained earnings. The use of debt and equity financing comes with a cost and risks. The firms often use a combination of debt and equity financing for tax savings (Brusov et al., 2015).
Modigliani and Miller stated that a firm could not change the value of a firm by changing the proportion of the capital structure. However, with the presence of taxes, a firm can increase the value of the firm by borrowings if the cost of debt is less than the cost of equity. Borrowing is generally cheaper because of the tax advantage. Miller and Modigliani's proposition assumes that without taxes, a firm has no incentive to borrow from outside. The borrowings increase the risk of a firm. That is why the increase in the cost of equity offsets the cost savings from the low-cost debt. With the presence of corporate tax, the value of a firm is positively related to debt. An all-equity firm pays more taxes than does a levered firm. That is why the sum of the debt and equity of a levered firm is greater than the total equity of an unleveraged firm.
The capital structures of Sainsbury and Next were studied using various ratios for a period of five years. Financial data was derived from financial statements in Appendix. Table 1 in Appendix indicates the elements of the capital structure of the two companies.
From the elements of the capital structure of the two companies, Sainsbury has more amount of debt and equity than Next Plc. That is, Sainsbury is more leveraged than Next. However, this data is not sufficient to explain the capital structure of the two companies. In this regards, capital structure ratios are useful in understanding how firms’ operations and growth are financed by multiple sources. The financial ratios can be used to show the capital structure of these companies over a period of five years, as indicated in Table 2 in Appendix.
Continue your exploration of Deep Market Dynamics with our related content.
Findings and discussions from capital structure analysis
In terms of similarity, both Sainsbury and Next use a blend of debt and equity sources. Debt sources are mainly constituted of long-term notes payable, while equity includes external (common stock) and internal (retained earnings) sources.
In terms of difference, although Next has a lower amount of debt, the proportional of debt to equity and assets is very high. It can be deduced that Next’s capital structure is highly financially leveraged compared to that of Sainsbury. High financial leverage implies that Next is more exposed to risks such as the risk of default and insolvency than Sainsbury. Based on the capital structure analysis, Sainsbury’s capital structure has remained relatively stable or constant. On the other hand, Next experienced unstable capital structure and unprecedented fluctuations. Such fluctuations can be attributed to unpredictable trends in fashion retail industry, as demonstrated by the growing popularity of online fashion retailers.
Cost of Capital of Sainsbury and Next
The cost of capital is used to evaluate the viability of investment projects in a firm. The cost of using debt is the interest that must be paid to the lender, while the cost of using equity is the dividend given to the shareholders as a return on their money. Interests must be paid to the lender whether the firm makes a profit or not, but the dividend can only be paid when the firm makes a profit. The dividend is more expensive than debt as it is not tax-deductible. The weighted average cost of capital is the total sum of the weighted cost of debt and equity of the firm. There are different valuation models that can be used to determine the cost of equity – CAPM or Capital Assets Pricing Model and DDM or Discounted Dividend Model.
Cost of Debt, Weight of Debt and Weight of Capital
The above values for cost of debt for Next and Sainsbury show that the cost of debt for Sainsbury is more than twice than that of Next. This is not a good sign for Sainsbury. Although Next is not considered as ‘big four’, it still manages to earn a higher profit margin as compared to Sainsbury. One of the main reasons behind this is a lower debt of cost due to which Next does not have to pay much in interest expenses.
The weight of Debt and Equity
Since a company's assets are financed by debt and equity; there is a need for the calculation of the weight of equity and the weight of debt. The market value of equity (E) is also called "Market Cap (M)".

WACC using CAPM Valuation Model
CAMP model is used in this case to estimate the required rate of return (RRR) of the equity of each company – Sainsbury and Next. CAPM model takes into account the risk of using equity because stocks are highly dependent on market dynamics. The CAPM is as follows:
RRR = Risk-free rate + beta (Market premium)
This analysis uses 10-Year Treasury Constant Maturity Rate as the risk-free rate. It is updated daily. The current risk-free rate is 1.3739%. The market premium, which is the expected rate of market return minus risk-free rate is 6%.
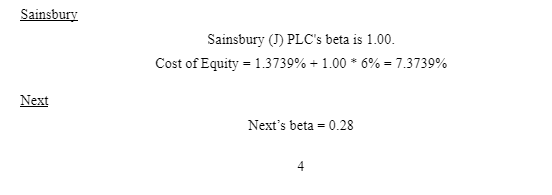
Cost of Equity = 1.3739% + 0.28 * 6% = 3.0539%
As per the cost of equity calculations, Sainsbury is a much better stock to invest than Next as it offers more than twice return. Further, the beta value shows that Sainsbury stock is not at all volatile as its beta value is equal to 1.
WACC based on CAPM
The average tax rate for a two-year period for Sainsbury is 19.55%, while that of Next is 19.05%.
Sainsbury’s WACC
WACC = weight of equity x cost of equity + weight of debt x cost of debt x (1-tax rate)
WACC = 0.8335 *7.3739% + 0.1665 * 8.4203% * (1 - 19.55%) = 7.27%
Next’s WACC
WACC = 0.8849 * 3.0539% + 0.1151 * 3.6149% * (1 - 19.05%) = 3.04%
WACC using DDM Valuation Model
Cost of Equity
The discounted dividend model or Gordon growth model can be used to estimate the required rate of return or cost of equity. The formula for DDM is given as follows:
where r = cost of equity.
In this case, there are three variables required: 2017 dividend (D), 2017 share price (P), and a three-year growth rate of dividends.

Conclusion
In conclusion, Sainsbury and Next use a blend of debt and equity capital sources. The capital structure ratios indicate that Next is more financially leveraged than Sainsbury due to a higher proportion of debt with respect to equity and assets. Sainsbury capital structure has tended to remain relatively stable for the last five years, while Next is unstable and keeps on fluctuating. The reason for this difference is attributed to different economic factors affecting the two companies. Sainsbury cost of capital is higher than that of Next, despite using two different valuation models – CAPM and DDM. The two valuations generate different WACC values, which can be explained by CAPM taking into account the risk factors in the market. WACC for Sainsbury is much higher in comparison to Next, thus, making it a riskier investment as stocks with higher WACC are considered to be more volatile.
References
- Armstrong, A. (2016). Supermarkets shrug off Brexit. The Telegraph. Accessed from
Baker, H. K., & Martin, G. S. (2011). Capital structure and corporate financing decisions: Theory, evidence, and practice. Hoboken, N.J: Wiley.
- Brusov, P. N., Filatova, T., Orekhova, N., & Ėskindarov, M. A. (2015). Modern corporate finance, investments and taxation. Cham: Springer
Guru Focus. (2018a). Next PLC (OTCPK: NXGPY) 3-Year Dividend Growth Rate: 3.40% (As of Jan. 2018). Access from
- Guru Focus. (2018b). Sainsbury (J) PLC (OTCPK: JSAIY) 3-Year Dividend Growth Rate: -11.50% (As of Mar. 2018). Accessed from
Rovnick, N. (2017). Sainsbury’s hit by sharp fall in quarterly sales growth. Financial Times. Accessed from
Wood, Z and Agency. (2018). Next chief calls 2017 'toughest in 25 years' as profits slide by 8%. Accessed

- As of Jan. 2018, Next PLC's interest expense (positive number) was $48 Mil. Its total Book Value of Debt (D) is $1,339 Mil.
- As of Mar. 2017, Sainsbury (J) PLC's interest expense (positive number) was $161 Mil. Its total Book Value of Debt (D) is $1,906 Mil.
- Currently, Sainsbury (J) PLC's market capitalization (E) is $9,541 Mil. The market value of debt is typically difficult to calculate; therefore, this analysis uses book value of debt (D) to perform the computation. It is simplified by adding the latest two-year average Current Portion of Long-Term Debt and Long-Term Debt & Capital Lease Obligation together. As of Mar. 2018, Sainsbury (J) PLC's latest two-year average Current Portion of Long-Term Debt was $209 Mil and its latest two-year average Long-Term Debt & Capital Lease Obligation was $1,697 Mil. The total Book Value of Debt (D) is $1,906 Mil.
- Currently, Next PLC's market capitalization (E) is $10,292 Mil. The market value of debt is simplified by adding the latest two-year average Current Portion of Long-Term Debt and Long-Term Debt & Capital Lease Obligation together. As of Jan. 2018, Next PLC's latest two-year average Current Portion of Long-Term Debt was $146 Mil and its latest two-year average Long-Term Debt & Capital Lease Obligation was $1,193 Mil. The total Book Value of Debt (D) is $1,339 Mil.
- Sainsbury’s three-year growth rate of dividends is estimated by Guru Focus (2018b) is -11.50%, the share price is £22.1, and dividend £.7 per share.
- Next’s three-year growth rate of dividends is estimated by Guru Focus (2018a) is 3.40%, the share price and dividend £40.93 and £1.35 per share.
Continue your exploration of The critical evaluation of an emerging issue in Accounting and Finance with our related content.
Introduction
Over the last decade, the retail industry in the United Kingdom has been dominated by four big players, which are supermarket chains, namely Tesco, Sainsbury, Asda, and Morrisson. The present report focuses on Sainsbury and Next. Sainsbury PLC is one of the 'the big four' players, whereas Next PLC is a market follower and is a relatively small company compared to the other big players in the retail industry. The retail market is mainly oligopolistic as 75% of the market is shared between Tesco, Sainsbury, Asda, and Morrisson. Sainsbury Plc Sainsbury is the second largest supermarket chain of the UK retail industry. The company was founded by John James Sainsbury in 1869. For businesses that are looking to delve deeper into the dynamics of the retail industry, seeking expert guidance, exploring topics such as business dissertation help can provide valuable perspectives. It has 1415 shops all around the globe and is a well-diversified conglomerate. The company opened Sainsbury Bank in a joint venture with Bank of Scotland and also has an agro-business. In 2011 the company opened Sainsbury Energy with British Gas. The company operates through 13 distribution channels. It provides product and services through Sainsbury Online. Next Plc Next Plc is a British multinational retailer of clothing, footwear, and home products. The company has almost 700 stores, out of which 500 stores are in the UK and Ireland and rest in Europe, Asia, and the Middle East. The company overtook Mark and Spencer in 2012 and is mainly operated through retail shops, Next directory (website with 3 million active customers), and Next international, which is a global shop. The company has some own brands such as Next sourcing and Lipsy. The company has a large investment to revive stores and marketing.
Industry Analysis and Economic Development
After Brexit, both Sainsbury Plc and Next Plc are experiencing sluggish growth. According to Armstrong (2016), after Brexit, it was forecasted that supermarkets have to increase grocery prices in the course of absorbing higher import costs attributed to a weakened Pound. Additionally, supermarkets are facing fiercely competition. Sainsbury, in particular, experienced plummeting quarterly sales revenue in 2017 as a result of inflation and competition (Rovnick, 2017). Sainsbury was forced to change its pricing strategy to “low prices every day” from special promotional offers, but then also it reported a reduction in pre-tax profits. Similarly, Next Plc has also hit by the weak pound and shifts from fashion retailers to the growing online transactions (Wood, Z and Agency, 2018). Thus it can be said that Sainsbury is facing fierce competition, while Next is experiencing pressure from fashion business shifting to online. Moreover, both are affected by a weaker pound caused by the Brexit.
The Capital Structure of Sainsbury and Next
The capital structure can be defined as the financing strategy of a firm for its operations, expansion and growth from various sources (Baker & Martin, 2011). A firm can be funded through debt in the form of long-term notes payable or bond issues or equity from preferred stock, common stock and retained earnings. The use of debt and equity financing comes with a cost and risks. The firms often use a combination of debt and equity financing for tax savings (Brusov et al., 2015). Modigliani and Miller stated that a firm could not change the value of a firm by changing the proportion of the capital structure. However, with the presence of taxes, a firm can increase the value of the firm by borrowings if the cost of debt is less than the cost of equity. Borrowing is generally cheaper because of the tax advantage. Miller and Modigliani's proposition assumes that without taxes, a firm has no incentive to borrow from outside. The borrowings increase the risk of a firm. That is why the increase in the cost of equity offsets the cost savings from the low-cost debt. With the presence of corporate tax, the value of a firm is positively related to debt. An all-equity firm pays more taxes than does a levered firm. That is why the sum of the debt and equity of a levered firm is greater than the total equity of an unleveraged firm. The capital structures of Sainsbury and Next were studied using various ratios for a period of five years. Financial data was derived from financial statements in Appendix. Table 1 in Appendix indicates the elements of the capital structure of the two companies. From the elements of the capital structure of the two companies, Sainsbury has more amount of debt and equity than Next Plc. That is, Sainsbury is more leveraged than Next. However, this data is not sufficient to explain the capital structure of the two companies. In this regards, capital structure ratios are useful in understanding how firms’ operations and growth are financed by multiple sources. The financial ratios can be used to show the capital structure of these companies over a period of five years, as indicated in Table 2 in Appendix.
Continue your exploration of Deep Market Dynamics with our related content.
Findings and discussions from capital structure analysis
In terms of similarity, both Sainsbury and Next use a blend of debt and equity sources. Debt sources are mainly constituted of long-term notes payable, while equity includes external (common stock) and internal (retained earnings) sources. In terms of difference, although Next has a lower amount of debt, the proportional of debt to equity and assets is very high. It can be deduced that Next’s capital structure is highly financially leveraged compared to that of Sainsbury. High financial leverage implies that Next is more exposed to risks such as the risk of default and insolvency than Sainsbury. Based on the capital structure analysis, Sainsbury’s capital structure has remained relatively stable or constant. On the other hand, Next experienced unstable capital structure and unprecedented fluctuations. Such fluctuations can be attributed to unpredictable trends in fashion retail industry, as demonstrated by the growing popularity of online fashion retailers.
Cost of Capital of Sainsbury and Next
The cost of capital is used to evaluate the viability of investment projects in a firm. The cost of using debt is the interest that must be paid to the lender, while the cost of using equity is the dividend given to the shareholders as a return on their money. Interests must be paid to the lender whether the firm makes a profit or not, but the dividend can only be paid when the firm makes a profit. The dividend is more expensive than debt as it is not tax-deductible. The weighted average cost of capital is the total sum of the weighted cost of debt and equity of the firm. There are different valuation models that can be used to determine the cost of equity – CAPM or Capital Assets Pricing Model and DDM or Discounted Dividend Model.
Cost of Debt, Weight of Debt and Weight of Capital
The above values for cost of debt for Next and Sainsbury show that the cost of debt for Sainsbury is more than twice than that of Next. This is not a good sign for Sainsbury. Although Next is not considered as ‘big four’, it still manages to earn a higher profit margin as compared to Sainsbury. One of the main reasons behind this is a lower debt of cost due to which Next does not have to pay much in interest expenses. The weight of Debt and Equity Since a company's assets are financed by debt and equity; there is a need for the calculation of the weight of equity and the weight of debt. The market value of equity (E) is also called "Market Cap (M)".
WACC using CAPM Valuation Model
CAMP model is used in this case to estimate the required rate of return (RRR) of the equity of each company – Sainsbury and Next. CAPM model takes into account the risk of using equity because stocks are highly dependent on market dynamics. The CAPM is as follows:
RRR = Risk-free rate + beta (Market premium)
This analysis uses 10-Year Treasury Constant Maturity Rate as the risk-free rate. It is updated daily. The current risk-free rate is 1.3739%. The market premium, which is the expected rate of market return minus risk-free rate is 6%.
Cost of Equity = 1.3739% + 0.28 * 6% = 3.0539% As per the cost of equity calculations, Sainsbury is a much better stock to invest than Next as it offers more than twice return. Further, the beta value shows that Sainsbury stock is not at all volatile as its beta value is equal to 1.
WACC based on CAPM
The average tax rate for a two-year period for Sainsbury is 19.55%, while that of Next is 19.05%.
Sainsbury’s WACC
WACC = weight of equity x cost of equity + weight of debt x cost of debt x (1-tax rate)
WACC = 0.8335 *7.3739% + 0.1665 * 8.4203% * (1 - 19.55%) = 7.27%
Next’s WACC
WACC = 0.8849 * 3.0539% + 0.1151 * 3.6149% * (1 - 19.05%) = 3.04%
WACC using DDM Valuation Model
Cost of Equity The discounted dividend model or Gordon growth model can be used to estimate the required rate of return or cost of equity. The formula for DDM is given as follows:
where r = cost of equity. In this case, there are three variables required: 2017 dividend (D), 2017 share price (P), and a three-year growth rate of dividends.
Conclusion
In conclusion, Sainsbury and Next use a blend of debt and equity capital sources. The capital structure ratios indicate that Next is more financially leveraged than Sainsbury due to a higher proportion of debt with respect to equity and assets. Sainsbury capital structure has tended to remain relatively stable for the last five years, while Next is unstable and keeps on fluctuating. The reason for this difference is attributed to different economic factors affecting the two companies. Sainsbury cost of capital is higher than that of Next, despite using two different valuation models – CAPM and DDM. The two valuations generate different WACC values, which can be explained by CAPM taking into account the risk factors in the market. WACC for Sainsbury is much higher in comparison to Next, thus, making it a riskier investment as stocks with higher WACC are considered to be more volatile.
References
- Armstrong, A. (2016). Supermarkets shrug off Brexit. The Telegraph. Accessed from Baker, H. K., & Martin, G. S. (2011). Capital structure and corporate financing decisions: Theory, evidence, and practice. Hoboken, N.J: Wiley.
- Brusov, P. N., Filatova, T., Orekhova, N., & Ėskindarov, M. A. (2015). Modern corporate finance, investments and taxation. Cham: Springer Guru Focus. (2018a). Next PLC (OTCPK: NXGPY) 3-Year Dividend Growth Rate: 3.40% (As of Jan. 2018). Access from
- Guru Focus. (2018b). Sainsbury (J) PLC (OTCPK: JSAIY) 3-Year Dividend Growth Rate: -11.50% (As of Mar. 2018). Accessed from Rovnick, N. (2017). Sainsbury’s hit by sharp fall in quarterly sales growth. Financial Times. Accessed from Wood, Z and Agency. (2018). Next chief calls 2017 'toughest in 25 years' as profits slide by 8%. Accessed
- As of Jan. 2018, Next PLC's interest expense (positive number) was $48 Mil. Its total Book Value of Debt (D) is $1,339 Mil.
- As of Mar. 2017, Sainsbury (J) PLC's interest expense (positive number) was $161 Mil. Its total Book Value of Debt (D) is $1,906 Mil.
- Currently, Sainsbury (J) PLC's market capitalization (E) is $9,541 Mil. The market value of debt is typically difficult to calculate; therefore, this analysis uses book value of debt (D) to perform the computation. It is simplified by adding the latest two-year average Current Portion of Long-Term Debt and Long-Term Debt & Capital Lease Obligation together. As of Mar. 2018, Sainsbury (J) PLC's latest two-year average Current Portion of Long-Term Debt was $209 Mil and its latest two-year average Long-Term Debt & Capital Lease Obligation was $1,697 Mil. The total Book Value of Debt (D) is $1,906 Mil.
- Currently, Next PLC's market capitalization (E) is $10,292 Mil. The market value of debt is simplified by adding the latest two-year average Current Portion of Long-Term Debt and Long-Term Debt & Capital Lease Obligation together. As of Jan. 2018, Next PLC's latest two-year average Current Portion of Long-Term Debt was $146 Mil and its latest two-year average Long-Term Debt & Capital Lease Obligation was $1,193 Mil. The total Book Value of Debt (D) is $1,339 Mil.
- Sainsbury’s three-year growth rate of dividends is estimated by Guru Focus (2018b) is -11.50%, the share price is £22.1, and dividend £.7 per share.
- Next’s three-year growth rate of dividends is estimated by Guru Focus (2018a) is 3.40%, the share price and dividend £40.93 and £1.35 per share.
Continue your exploration of The critical evaluation of an emerging issue in Accounting and Finance with our related content.


- 24/7 Customer Support
- 100% Customer Satisfaction
- No Privacy Violation
- Quick Services
- Subject Experts