Qualitative and Quantitative Data
Qualitative data refers to information that is not statistical in nature and is essentially unstructured or semi-structured (Bergin 2018). It is not measured by hard numbers that can form charts and graphs but instead categorized on the basis of labels, properties, attributes and other possible identifiers. Due to its open ended and investigative nature it is used by researchers to answer the question why. Data that is collected from this is used for the development of hypothesis, initial understandings, theorizations and interpretations. It is generated through observation and notes, texts and documents, images and symbols, interview transcripts and focus groups and lastly recordings (Oflazoglu 2017).
Quantitative data is a contradiction of qualitative data as it is very statistical and structured. It is estimated through the use of values and numbers and is the perfect method to analyze data with (Oflazoglu 2017). It is specific and close ended unlike the qualitative method. Mainly used to find out details like how many, how much and there is usually a concluding information at the end. The data is generated through market reports, tests, experiments, metrics and surveys (Bergin 2018).

Horizontal and Vertical Analysis (under the subject of trend analysis)
Trend analysis is a technique used by technical analyst in the financial industry to determine how a given asset will move in the future through the use of historical data. Horizontal and vertical analysis are techniques that can be used in trend analysis (Gibson and Charles 2012).
Horizontal analysis is a financial analysis procedure in which there is a line by line comparison of the amount of financial information over a given timeframe so as to make related decisions. This aids in getting to know how the results have shifted from one financial period to another. It can be calculated in either percentage or absolute terms. It is useful when comparing company results with past financial years (Sinha 2012). An example is when an investor makes use of the horizontal analysis to look into the earnings per share ratio of a business before deciding whether to invest in it or not. The continuous year in year out growth of the business will result into an encouraging progressive trend which is a positive sign to make the investment if other factors are conducive as well. In terms of managers it is used to find out areas that need improvement in a company. The profit margin in comparison to the cost of goods sold over a certain period of time depicts the efficiency of a business and lays bare the areas that need altering.
Vertical analysis looks into financial statements in terms of listing every line item as a percentage of another item so as to make decisions. Each line item that is on the income statement is listed as a percentage of sales revenue and every line item is depicted on the balance sheet as a percentage of the total assets (Sinha 2012). It is used more when one is comparing other company results against a specific company. It derives the name vertical due to the up and down movement of an individual’s eyes when they look at and analyze the financial statements. An example is when the base amount that is taken from an aggregate of the same year`s financial statement is set to evaluate the success of a business. The common size percentage formula, which is calculated by dividing the item that is being analyzed by the base amount of the benchmark and then multiplying it by 100, is then applied to the financial item.
Statistical and Big data
Statistical data is an area that is involved in the study of data in various fields. It provides the researcher with a methodology for making conclusions from the available data (Bibri 2019). It offers different methods on collection, analysis and interpretation of results and is majorly used by mathematicians, scientists and researchers in getting solutions to problems. It is identical to data intensive activities of collecting, processing and interpretation of data that has been processed (Carlberg 2014). Example is numerical data that shows countable items, categorical data that represents characteristics and lastly ordinal which is a combination of the numerical and categorical data.
Big data analytics is usually referred to as the complex process of looking into huge and varied data sets commonly called big data to uncover information relating to market trends, consumer preferences, hidden patterns and unknown correlations that can be useful to businesses in making informed decisions (Zikopoulos 2011). It involves complex applications with elements such as statistical algorithms, what –if analysis and predictive models that are powered through analytic systems with high performance. It is usually in unstructured formats and contains data that is not numerical. Unlike statistical useful information big data can easily get buried due to the huge nature of blogs, social networks, text messages images, audios or files and so on that get captured and analyzed (Nisbet et al. 2018). An example of big data would be 900 petabytes of data with records of millions of people that result to billions of records that provide different information about the people. This information is sourced from numerous places like mobile data, social media, web and the rest. This depicts a loosely structured kind of data that is not complete and readily accessible.
Data Quality and Its Importance in Financial Statements
Data quality can be defined as an elaborate method of evaluating data properties from various perspectives. It is an overall examination of the fitness, reliability and application efficiency of data. Institutions highly rely on data quality as it is crucial for operational and transactional processes and also the longevity of business analytics and business intelligence reporting (Bartlett 2013).
The part that accurate financial statements play in a business cannot be undervalued as the numbers play a key role in determining success, making decisions, estimating shortfalls, putting together strategies and explaining about the company. And for financial statements accuracy there is high dependency on data quality. Data quality is important in that it provides financial transparency. Even the tiniest of numbers impact a business largely and therefore the need to be critical in accurately posting figures (Wahlen et al. 2011). This explain to the management and shareholders the clear financial picture of the business. Tax liability is also evaluated through financial statements. In order for the managers to avoid the burden of overpaying their taxes and forgery to protect businesses from governments scrutiny accurate financial statements are key. Errors that could be costly are flagged through data quality early on in the process and this prevents further damage and losses. The discrepancies in numbers will point out to any wrongdoings or illegal activities in a company (Sadiq 2013). Trust is crucial in the growth of a business and attracting investors. Accurate financial statements that are made possible through data quality encourage trust in the company. There is also improved payments cycles. So as to maximize the cycles of the accounts receivables and accounts payables accurate financial statements play a vital role. This cannot be achieved unless the numbers are appropriate and this is ensured through data quality. Lastly it influences better planning, forecasting and decision making. When vital decisions are to be made by a business there is always scrutiny of the financial statements to determine the way forward. The affordability and sustainability of decisions in terms of costs are made from a numbers perspective. Numbers that can be provided clearly through data quality (WAHLEN et al. 2011).
Aircraft type with the largest fleet (number of aircraft) as at December 2017
The aircraft type that had the largest fleet (number of aircraft) as at December 2017 is Airbus A320 at 67.
Biggest representation in the British Airways fleet as at December 2017
Airbus had the biggest representation in the British Airways fleet as at December being represented by
Percentage does the figure in (b) represent of the overall total in 2017
Airbus had a total of 142 fleet representation at the end of the year 2017. The overall number of all fleets represented is 293. To work out the percentage the figures have to be compared to the overall total of 100%
293 fleets represent 100%
Therefore 142 fleets= 142×100 then the figure is divided by 293
Percentage is = 14200÷293
=48.4642%
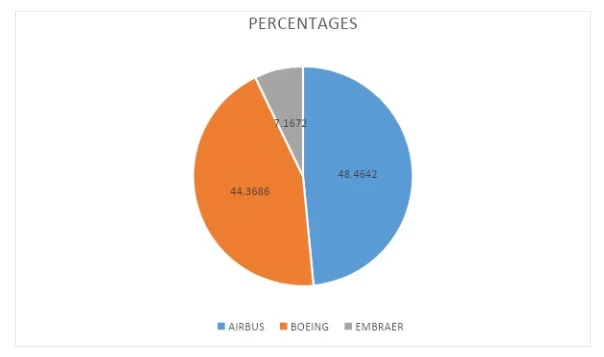
Fully-labelled pie chart showing the 3 aircraft manufacturers’ percentages of the total fleet in December 2017
Boeing=36+3+8+46+12+9+16
Total fleet=130 converted to percentage as 130×100/293
Percentage=44.3686%
Airbus=1+44+67+18+12
Total fleet=142 converted to percentage as 142×100/293
Percentage=48.4642%
Embraer=6+15
Total fleet=21converted to percentage as 21×100/293
Percentage=7.1672%
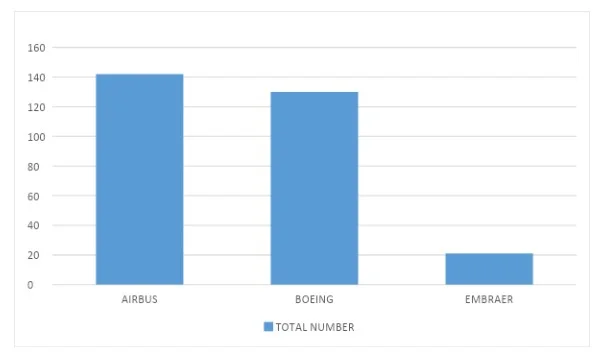
Suitable graph or chart to show the total number of each aircraft type in the British Airways fleet as at December 2017
Task 2: Discuss the performance of British Airways Group using the following ratios: Return on Capital Employed, Return on Equity, and the Current Ratio. (Use the given Annual Report to source the necessary information).
Return on capital employed is a profitability ratio that measures how competently a business can make profits from its capital employed through comparing net operating profit to capital employed. It measures how well a company is generating profits from its capital. It is considered an important profitability ratio and is used often by investors when screening for suitable investment candidates.
Calculated as
ROCE=EBIT/CAPITAL EMPLOYED
EBIT is Earnings before tax and interest
Capital employed is obtained by subtracting Current liabilities from Total assets
=293/212-81
=293/131
ROCE=2. 2366
The return on capital employed ratio is high which means that the British Airways group is doing relatively well and favorable for investing in.
Return on equity looks at how efficiently a firm can make use of the cash from shareholders to make profits and in turn grow the business. It is a ratio from an investor’s point of view unlike the other ratios. It looks into the amount of money made from the money put in the business by an investor. It is calculated by dividing net income by equity of the shareholder.
=Net income/Shareholders equity
Net income=212-81=131
Shareholders equity=70
=1.8714 this is a relatively high ratio which means that for every 1 input of money the investors put in they got a return of around 187%.
Current ratio is an efficiency and liquidity ratio which measures the ability of a business to pay off its short-term liabilities with the current assets that it holds. It is a vital liquidity measure due to short term liabilities being due within the coming year. It is calculated by dividing current assets by current liabilities.
Current assets=212
Current liabilities=81
CR=212/81
=2.6173
According to its current ratio British Airways Group has more than enough asset to pay off its current liabilities as all the current liabilities are fully covered by the assets it has.

Risk factors that could adversely affect British Airways Group’s market position and revenue.
Risk are the exposures that a company or organization may experience that will negatively impact on its profits or lead to business failure. There are numerous risk factors that could affect British Airways group market position and revenue as discussed below. Market fluctuations that arise due to shifts in economic cycles in regions that result to demand shifts by customers is one of the factors that may affect it (Labbi 2005). Even though it closely looks at market condition changes it is hard to totally avoid impacts that market fluctuations will have due to economic cycles experienced by countries around the world. Changes in interest rates and foreign exchange. Due to the fact that the airline engages in activities all over the world in various currencies it is prone to being affected by fluctuations in foreign exchange and interest rates (Sadgrove 2016). Natural calamities such as thunder strikes and bad weather adversely affect the operations as the airline cannot have its normal scheduled planes and operations as is the requirement and this leads to cancellation of flights that reflect negatively on the revenues earned at the end of the year. Competition is something that any institution in business will have to face and the preparedness of your competitor to challenge you for a piece of the market share plays a huge role in the revenues that will be obtained at the end of the day (Labbi 2005). If your competitor is better and provide better services the business risks losing clients to the competition which leads to a drop in revenue (Peterson 2012). Implementing management strategies to handle and steer the company against foreseen risks and development projects are necessary but costly and due to tough economic conditions some of these strategies that are necessary may be foregone weakening the position of the airline in the market (Lebedeva et al. 2016). The kind of business activities that are undertaken by the airline worldwide will either drive its market value and position up or down depending on how they are handled and how much money they bring in. Financing is a major risk factor that the airline may have to take. Even though it has been financing its activities relatively comfortably it may have to seek extra funds to cater for the rapidly expanding market and invest in infrastructure technology wise and structure wise. With the rapidly growing technology it is not easy to keep up as it is costly and requires regular updating for a smoother customer experience. Legal barriers can be a huge hindrance to the growth of the airline due to the different laws operating in various countries, they might limit the pace at which things are to be done derailing growth and market penetration rate which in turn affects the revenue growth of the industry in the end (Sadgrove 2016). The management of information is vital for the sustainability and growth of the business if used in the right manner. On the other hand there is the risk of information leakage to competitors or other sources that might use it to their advantage rendering the business defenseless and without a comeback plan (Lebedeva et al. 2016).
British Airways Revenue Over 5 Year Period between 2013 and 2017
Revenue is defined as the income made from the sale of services or goods, or any other given assets or capital that is associated with the major organizational operations before any expenses or costs are removed (Bragg 2013). It is usually portrayed as the first item in an income statement from which all expenses, charges and costs are subtracted to arrive at net income. To comment on the income there must be available guiding figures of the mean and standard deviation from the available data. Standard deviation is a statistic that measures the dispersion of a dataset relative to its mean and is obtained by finding the square root of the variance (Rees 2018). This is done through finding out the variation between each data point in relation to the mean. The furthest the data points are from the mean the higher the deviation within the data set.
Standard Deviation=√∑i=1n(xi−x)2/n-1
Mean=∑x/n
Mean
11421+11719+11333+11398+12226=58097
58097/5=11619.4
Mean=11619.4
Standard Deviation
11421-11619.4=-198.4
11719-11619.4=99.6
11333-11619.4=-286.4
11398-11619.4=-221.4
12226-11619.4=606.6
Getting the square values
-198.42=39362.56
99.62=9920.16
-286.42=82024.96
-221.42=49017.96
606.62=367963.56
Total =548289.2
Variance= √548289.2/4
=√137072.3
Standard deviation= 370.2328
The mean and standard deviation within the five year range for the British airwave revenue were 11619.4 and 370.2328 respectively. The disparity between Standard deviation and mean is expected to depict the clear picture of whether the business is still on track to achieve its set out objectives and realize the profits or not (Rees 2018). In this case the standard deviation is far below the mean during the estimated five year period between 2013 and 2017. The large difference that is there shows how much revenues obtained are deviating from the expected normal returns. The revenue over the period under analysis has been awful and unpredictable with many negatives instead of positive increments in revenue. This keeps the business stagnant as no meaningful steps can be made due to lack of consistency in growth.
Continue your journey with our comprehensive guide to Qualification in Principles of Management and Leadership.
References
Bartlett, R., 2013 PRACTITIONER'S GUIDE TO BUSINESS ANALYTICS. New York, McGraw-Hill Publishing. https://public.eblib.com/choice/publicfullrecord.aspx?p=4958381.
Bergin, T., 2018. An introduction to data analysis: quantitative, qualitative and mixed methods.
Bibri, S. E., 2019 .Big data science and analytics for smart sustainable urbanism: unprecedented paradigmatic shifts and practical advancements.
Bragg, S. M., 2013. Wiley revenue recognition: rules and scenarios. Hoboken, N.J., Wiley. https://rbdigital.oneclickdigital.com.
Carlberg, C. G., 2014 .Statistical analysis: Microsoft Excel 2013.
Gibson, Charles H., 2012. Financial Reporting and Analysis + Thomsonone Printed Access Card. South-Western Pub.
Lebedeva, T.E., Akhmetshin, E.M., Dzagoyeva, M.R., Kobersy, I.S. and Ikoev, S.K., 2016. Corporate governance issues and control in conditions of unstable capital risk. International Journal of Economics and Financial Issues, 6(1S), pp.25-32.
Nisbet, R., Miner, G., & Yale, K. P. 2018. Handbook of statistical analysis and data mining applications.
Oflazoglu, S., 2017. Qualitative versus quantitative research. https://hdl.handle.net/11159/1812.


What Makes Us Unique
- 24/7 Customer Support
- 100% Customer Satisfaction
- No Privacy Violation
- Quick Services
- Subject Experts