Sales Simulation and Sensitivity Analysis
Part 1
The report presents a base model of the sales accompanied with a a base cover of around 10 years. This report considered randomness while also taking into consideration the simulation experiments. More attention could be given to the sensitivity analysis of the changes in the profit margin, which is expected to be uniform and distributed between 5-10%. The key area is to justify the model as the true account of the situation presented in the simulation. The implementation process of the simulation adopted an approach with the help of the AnyLogic model. In the first activity, a simulation was created in which the agents as well as the processes being modelled could be identified. Secondly, due to changes in the figures assigned to the model or the parameter, there was need to create the “custom experiment” with the help of AnyLogic (Merkuryeva and Bolshakovs 2010). The integration of the optimization procedure helped customize the experiment with direct external codes being called. It is worth noting that the case applied what is commonly known as the metaheuristic solution procedure, which was identified through a Tabu search. After running multiple simulations, it was possible to attain a single setting. Subsequently, custom experiments would cause changes in the input parameter, which would make room for running the simulation several times while the returns carry a solution value aligned to the settings. However, with the system memory, it would not be possible to run several computations and simulation replications, which is possible when the memory can be adjusted.

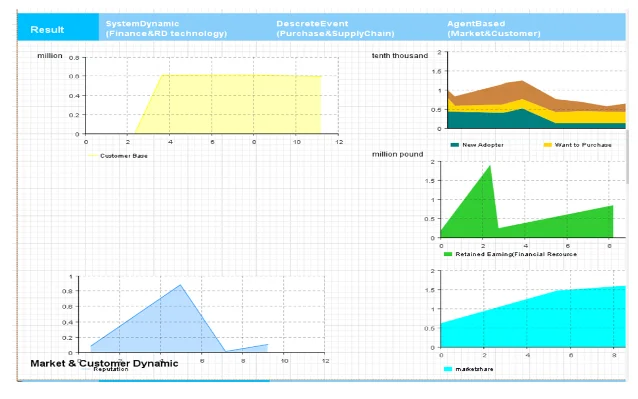
The important aspect of the simulation process includes of the returns influenced by the optimization procedures introduced to AnyLogic. Based on the case presented, the open hubs would appear with the binary variable while setting and updating the optimization procedure. From the start, it is more effective to run the simulation checks, which can be performed on the latest versions of AnyLogic. When introducing an input such as a profit margin that ranges from 0.5–1%, it is more appropriate to re-run the simulation following the adjusted input. Obviously, the next run will present an optimized result. At this point, one can easily output the results as well as present the statistics in various ways. However, the context sets a preference on multiple optimizations, which makes room for an analysis of the effect of the varying parameters. While running the simulations, a trade-off must be established between evaluating and improving the solutions (Borshchev et al. 2002). Common obstacles can be encountered at different points, but the developer needs to learn how to overcome them while trying to modify the codes or debug an erroneous encounter in the course of the simulation process, both in the run and re-run.
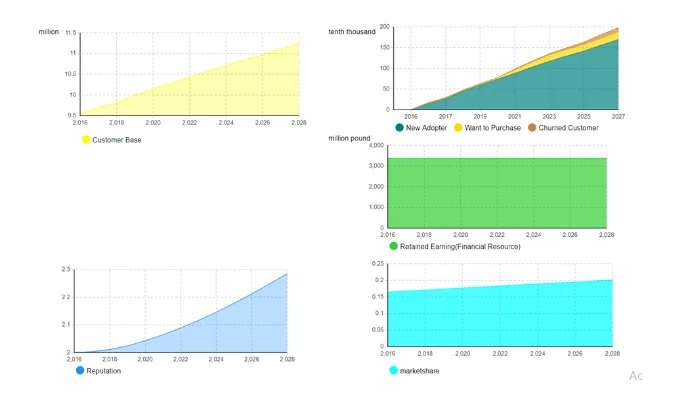
Sensitivity analysis is another significant component of the experiment. In this context, sensitivity analysis points out how uncertainty is noted in the outcome of the mathematical model of the given system and can be assigned to sources. In the sensitivity analysis experiment, the Anylogic software would detect the number of codes available and then run several iterations concurrently on separate cores. Randomness was considered using the random number generator to initialize the random number of a fixed seed. If the random seed is produced, the runs may not be reproduced because the generator was given a different value for the initial number. If the model is given the value 7.4% or 0.074 for profit margin, then the sensitivity analysis will produce the following behaviour in the shopping process and retail functions:
However, if 10% of the profit margin is introduced into the model, then the simulation takes a subclass of the random values. The sensitivity analysis will take the format seen in Figure 4.
Part 2
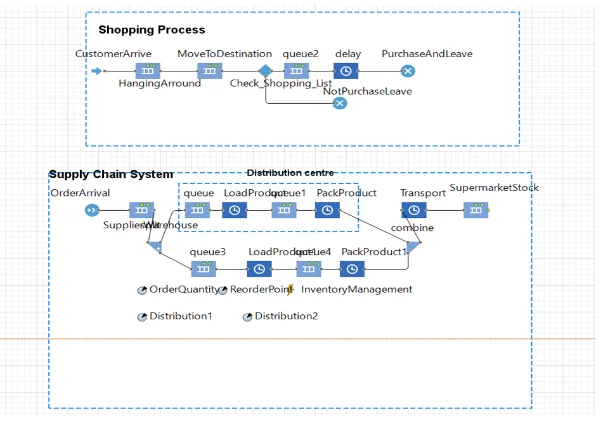
The report also reflects the modification of the discrete event of the base model and explains the scenarios in which the retailer invests in a new distribution centre. The model needed to be modified to constitute the new distribution in parameters, such as how the percentage of the deliveries is incorporated in the new centre. The model also includes details about the workers, whereby loading alone would demand two workers and parking demands only one. It should be noted that 20% of the total goods are in the freezer and 30% are in the chilled storage. The remaining 50% of the gods are stored in the ambient temperature warehouse. During the ideation process, it was more appropriate to first think of optimizing the warehouse and the parking yard while considering the layout as well as the operation. This would be accompanied by the essence of forecasting that points at possible changes while addressing the operational needs. Before starting the simulation model, it is worth noting that the optimization goal should clearly be defined, and the GUI should be put in place to reflect the expected outcome. The ultimate goal in this section is to ensure that the designer develops a simulation that will improve both the parking and warehouse efficiency in the new distribution centre. This attracts different types of efficiencies that need to be modelled. These types include the truck efficiency, storage efficiency and employee efficiency. Maximization of the work, storage and retail truck efficiency demands the most competitive goals, which can be handled via the multi-objective Pareto optimization. In such a case where the warehouse is likely to fill within a few days, then it requires a stabilization of operations. This means that operations in a warehouse would effectively be evaluated after around 10 days of operating. Some of the functions that can be introduced to the model include the maximization of pallet storage efficiency, maximization of worker efficiency and maximization of retail truck efficiency. In designing the new distribution centre, the retail would focus on the warehouse and the parking yard. The simulation narrows down to the warehouse simulation model, which plays a role in the company’s logistics system. The simulation model has the primary objective of establishing the relationship between the input and output parameters, which are part of the warehouse performance measures. For the purposes of implementing the relevant logic and rules, the ad hoc java routines would be developed and stored in the model subsections as opposed to the classical modelling approach. In essence, more attention is given to the graphic user interface, which provides the anticipated pictorial output. The project would focus more on making the model even more flexible in the face of the input parameters while also gauging the simulation run and the run-time noted with the warehouse behaviour.
Flexibility is necessary for the structure, resources and processes of retail functions. The significant parameters include the number of docks, inspectors and forklifts as well as the arrival time, the opening hours, the offload and inspection time and the time necessary for putting away the staging area. For parking yard optimization, it is worth noting that the input values remain relatively constant apart from the adjustments made by the retailers or the decisions made by the In-Mold Labelling (IML). The arrival times are distributed through Poisson in the presence of discrete frequency distribution which showcases the probability of a range of the independent events that happen within a given fixed time. The report also adopted quality assurance techniques, such as control charts, while pursuing the reduction of discrepancies, which led to better and more accurate outcomes. In terms of the calculation, the simulation process adopted the inbound yard calculations while looking to reduce the operating expenses. Something that made the simulation more interesting is the fact that the relevant inputs can also be changed instantly. For instance, changing a variable, such as purchase per customer, would give a smooth graph.
Simulation scenarios would happen when intending to add an extra offloading dock. Adjustments give room for determining different outcomes as is the case when determining the total expenses. The model also took care of the vendor scheduling calculations, which were more inclined to the base rules that apply to the inbound yard (Fu-gui et al. 2012). It is good to keep communication with the vendors for the purposes of determining what time the trucks are expected to arrive or when they are required to split up. The outputs of the inbound yard would generate calculation as well as simulation. Operational conditions would ultimately help determine the standards that would be observed by the inbound yard. In the course of the simulation process, the simulations are often run to determine a tactical strategy, which will help narrow the chances of discrepancies across the model. The output process is as shown in Figure 7. Both the shopping process and the distribution should provide space for the yard with the central purpose of ensuring a smooth flow of the goods in and out of the warehouse and the shopping mall.
Part 3
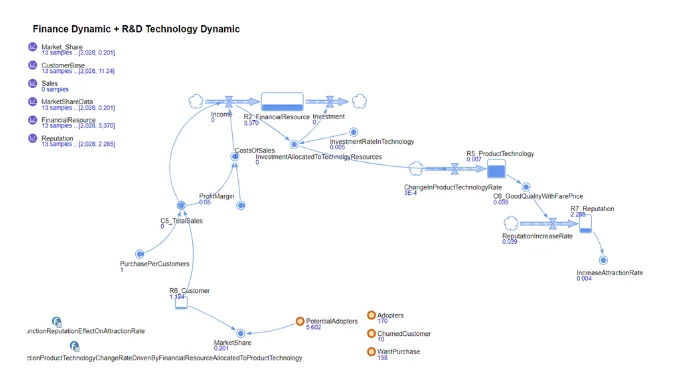
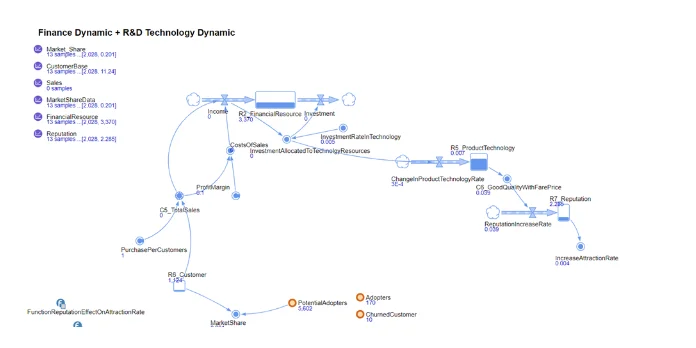
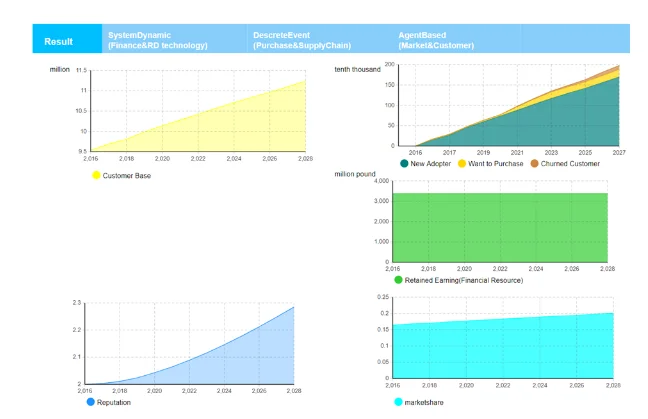
Lastly, the simulation process took into consideration the need to modify the system dynamics for the purpose of investigating what would happen for the next 10 years if the retailer chose to invest around 3% of the financial resources every year into developing the process and the IP systems. The modification of the model incorporated advanced technology, which was essentially measured using advanced technology units. Some of the assumptions include the fact that the adopted technology is likely to hit maturity in the next two years. During the ideation process, it was necessary to think of an automation system that would allow the retrieval of goods, automatic storage and material handling systems, which would be supported by an IT infrastructure. In essence, the retailer would want to attain a fast response as well as a high throughput. The transitions could be triggered by more specific events, such as retail conditions, timeout, arrival and message that put in place the query, among other things. While trying to minimize the costs, the model would take into consideration the attributes, agents and behaviours linked to the system. In the second category of requirements of optimization, the model defined the mode of interaction and the agent relationship (Wai and Ostroukh 2014). In this second category of requirements, it was necessary to define the topology involved in the connectedness of the simulation parameters and in the interacting agents. The last category demanded the definition of the agent’s environment while taking into consideration the conditions of the interacting agents. During the simulation, the model took care of the transitions across the functional states which could be modelled for timeout, message or query and the condition or simulation command. If a new order is introduced, then it implies that the flow would take the first branch asking, or sending the message asking, whether the order or the query can be handled considering the available resources. The output of the model includes the order lines while keeping the tolerant scales or limits. Each line of the output portrays a specific item; however, the retailer still has to cater to the costs of incomplete orders in the system while sharing the customer feedback at the end of the process.


Part 4
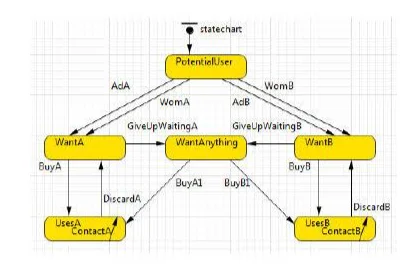
This section presents a state chart of detailed market research about customer behaviour. A number of assumptions could be made before producing the state chart. First, it could be assumed that brand attraction as well as word of mouth convinced 30% of the purchase. The remaining portion attracted research that ran for 5–10 days. It could also be presumed that only 25% of the adopters are the ones making an attempt to convince others to make a purchase. If the adopters stop being one of the purchasers due to the competitive price, then it would imply that there is no purchase that would be made if not for the Amazon Prime subscribers. Those who are not subscribed will join at a rate of 4% in a year. The state chart is shown in Figure 9.
References
Fu-gui, D.O.N.G., L.I.U. Hui-mei and L.U. Bing-de, 2012. Agent-based simulation model of single point inventory system. Systems Engineering Procedia, 4, 298-304
Merkuryeva, G. and V. Bolshakovs, 2010. Vehicle schedule simulation with AnyLogic. In 2010 12th International Conference on Computer Modelling and Simulation, March, 2010, pp.169-174 IEEE
Wai, P.A. and A.V. Ostroukh, 2014. Development of simulation model mixed system in the AnyLogic software. International Journal of Advanced Studies, 4(4), 48-53
Borshchev, A., Y. Karpov and V. Kharitonov, 2002. Distributed simulation of hybrid systems with AnyLogic and HLA. Future Generation Computer Systems, 18(6), 829-839
- 24/7 Customer Support
- 100% Customer Satisfaction
- No Privacy Violation
- Quick Services
- Subject Experts


