Utilizing Network Diagrams In Power Plant
NETWORK DIAGRAM
A network diagram is a diagrammatic representation of different activities in a project, essential for effective project management dissertation help. It also shows the relationship shared by these activities (Lock, 2017). Such association can be shown in the form of the arrow-on-arrow method where the activities dependencies are shown in the form of arrows going from one activity to the next one. The precedence method shows an early start, early finish, late start and late finish. It also shows the relationships and dependencies in the project.

In this report, both Microsoft Project, as well as Excel, was used to show dependencies between the activities in the power plant project. Early start, early finish, late start and late finish can be seen from the network diagram along with the float or the delays. The network diagram also shows the critical path, i.e. the longest path of the planned activities to complete the project on time and within given budgets. The critical path can help the managers and authorities in ranking all the activities and take actions through which they can be completed within given time frames and budget. Through a network diagram, they can also determine the amount of time for which an activity can be delayed (float). In the current project, this is shown through red arrows in the excel file and through a pink arrow in the Microsoft Project file.


GANTT CHART
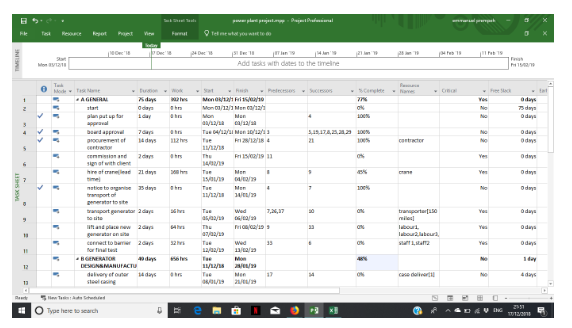
The main purpose of Gantt chart is to help the project managers and stakeholders of the project to determine a schedule of the activities and procedure to conduct successfully carry out the project (Geraldi and Lechter, 2012). It helps in managing time and activities effectively, thereby ensuring that the project is successfully completed within the given time limit and the specified resources.


One of the biggest weaknesses of a Gantt chart is that it does not show the relationship between activities (Pasian, Sankaran and Boydell, 2012). Through a Gantt chart, readers cannot understand how the start of an activity is dependent on the other. This significantly limits usefulness and effectiveness of the Gantt chart, but it can be easily managed with software such as Microsoft Project. The Gantt chart produced through Microsoft Project shows the dependencies while the one produced through Excel does not show them. Furthermore, the Gantt chart considers only one scenario during a project, while there are numerous events that can have an adverse impact on the project. With such charts, it is very difficult for the project managers and authorities to show changes that might happen in real life and influence the project. It becomes difficult to identify on a Gantt chart when several activities merge into one activity or depend on that activity as compared to network diagram that will show all the activities and how the relationship is which is very necessary for estimating the project duration and progress.
BUDGET
One of the key success criteria for any project is its cost and time management. It is imperative for the authorities to ensure that the project is completed within the given time frame and within the specified budget as well. In this regard, it can be said that it is crucial for the project managers to practice value management, through which they can effectively manage the relationship between functions and costs. The success of a project is also affected by its duration (Lock, 2017). It further influences the cost of the project. The longer time it takes to complete a project, the more costs will have to be incurred in the project. The current project, although will take 72 days to complete, to reduce its time to 60 days, several activities like placing the generator on site, connecting barriers for final test and many more can be completed together. This way a considerable amount of time can be saved. This way the cost of the project can also be reduced significantly. Herein the budget was developed using Microsoft Project. The Budgeted Cost of Work Scheduled (BCWS) was £120,572 without the 10% contingency and £132,629.20 with the 10% contingency.


EARNED VALUE
The earned value can be defined as a project control tool that evaluates the amount of budget that should be spent on comparing the cost of work performed with the baseline cost for the task, resource or the assignment itself. Through earned value, the authorities can determine if the project is over the budget or under the budget. This way they can identify the changes that need to made to improve overall functioning and effectiveness of the project. It analyses the budgeted cost of work performed (BCWP) which essentially is the physical progress of the work that has been completed. The BCWP is expressed as the total cost of planned work that has actually been completed in relation to time and cost. Through the earned value system, at 20% completion of the project, the final results can be expressed or projected within a plus or minus confidence range. Through earned value, the project managers can determine the actual results that could change during the lifetime of the project. In order to calculate the earned value, the following example can be considered. The project can be assumed to be 40% completed with its planned budget or BCWS of £120,572. This information can be useful in calculating the schedule variance as well as a schedule performance index.
Since the figures for both SV and SPI are less than 1, the project is seen to behind schedule. The following two images show earned value through Microsoft Project if the project is on 0% completion rate.
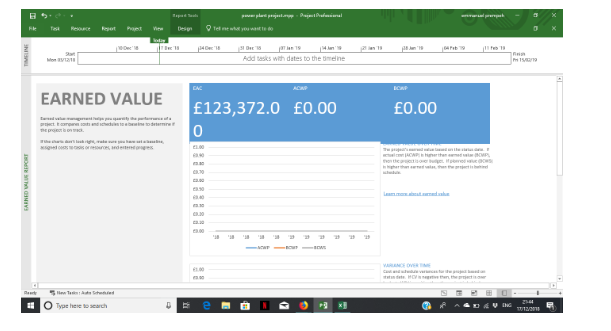

In the following images show the impact of the change in various activities on the earned value of the project. It has been calculated through Microsoft Project.
Continue your exploration of Use of innovative processes and to enhance an external audit with our related content.


REFERENCES
- Geraldi, J. and Lechter, T., 2012. Gantt charts revisited: A critical analysis of its roots and implications to the management of projects today. International Journal of Managing Projects in Business, 5(4), pp.578-594.
- Lock, D., 2017. The essentials of project management. Routledge. Pasian, B., Sankaran, S. and Boydell, S., 2012. Project management maturity: a critical analysis of existing and emergent factors. International Journal of Managing Projects in Business, 5(1), pp.146-157.


What Makes Us Unique
- 24/7 Customer Support
- 100% Customer Satisfaction
- No Privacy Violation
- Quick Services
- Subject Experts