Viewing Habits on Video-On-Demand Service
INTRODUCTION: 2020 – A YEAR TO BE REMEMBERED
The Video on Demand Service, also known as VOD, has grown throughout the last decade (Yuan, Wang and Bin, 2020). Broadcasters such as BBC, Channel 4, ITV all have their own VOD players where the viewers can watch all its content. As mentioned previously, this kind of service is growing fast, but we had something new that happened last year: Covid-19. Amidst this specific pandemic, the demand for media content surged, leading to an unprecedented boom in streaming services. This shift in behavior shows a rich field for exploration in media dissertation help.
The pandemic has affected everyone in a variety of ways, be it the lack of human interaction and contact, working from home every day in ways never before thought of by many employers, as well as new ways to keep us entertained at home for long months (Feldmann et al. 2021).
Covid-19 has sped up the uptake of VODs (Azhar et al. 2021). The SVOD (Subscription VOD) services are launching on what feels like a daily basis. Away from Covid, 2020 has highlighted how important it is to show consumers what the brand stands for. With Black Lives Matter and Diversity & Inclusion high on the agenda, how a business treats customers and how it behaves can make or break it (Ni, Liu and Zheng, 2021). This is a new time where staying quiet is the same as being complicit. All this information can be important when analysing how the viewing habits on VOD compare to linear television.
An Ofcom research published on the BBCs website, we have a clear idea about how lockdown impacts the UK viewers:
Lockdown measures enforced due to the Covid-19 pandemic brought about a surge in TV watching and online streaming, according to media watchdog Ofcom.
Its annual study into UK media habits suggested adults - many stuck indoors - spent 40% of their waking hours in front of a screen, on average.
Time spent on subscription streaming services also doubled during April. At the height of lockdown, adults spent an average of six hours and 25 minutes each day staring at screens .

Screen time overall was up almost a third (31%) last year.
People watched streaming services, such as Netflix, Amazon Prime Video and Disney+, for one hour 11 minutes per day, and 12 million people joined a service they had not used previously. Three million of these viewers had never subscribed to any service before. The majority signed up to Netflix and Amazon Prime Video, although Disney+ overtook Now TV as the third most popular paid-for streaming platform.
Older viewers, who typically watch more traditional broadcast TV, increased their use of streaming platforms, too.
One-third of 55-64-year-olds and 15% of people aged 65+ used subscription services in the early weeks of lockdown.
The study, entitled Media Nations 2020, suggested that as lockdown measures eased towards the end of June, the uplift in streaming services held firm - 71% up on the same time last year. This figure also included people viewing more non-broadcast content on platforms like YouTube and gaming sites.
Furthermore, more than half of UK adults (55%) with new streaming subscriptions said they would keep them and spend the same amount of time watching streamed content in future.

Away from Covid, 2020 highlighted how important it is to show consumers what your brand stands for. With Black Lives Matter and Diversity & Inclusion high on the agenda, how a business treats customers and how it behaves can make or break it. This is a new time where staying quiet is the same as being complicit, and therefore what we say and, more importantly, what we do can profoundly impact how we are perceived (Schanke, Burtch and Ray, 2021).
It has never been more critical for broadcasts companies to understand their viewers, how they think, how they feel and what motivates them (Kim, Yoo and Yang, 2020). They can no longer think of their viewers as a particular demographic group, just based on their age and area.
According to research published by Catherine Johnson (Professor in Media and Communication, University of Huddersfield and Lauren Dempsey (PhD Candidate, University of Nottingham), coronavirus might have changed TV viewing habits for good:
“When TV viewing went up overall during the spring lockdown, the most significant growth was in streaming services, while increased viewing for live TV was primarily driven by news consumption. After the lockdown was relaxed, it was streaming that retained its uplift, while time spent watching broadcast TV gradually declined back to normal levels.
Coronavirus fundamentally changed people’s reasons for watching TV. Whereas before, it was often associated with distraction and unwinding, the people we spoke to were rife with anxiety and turned to TV to relieve the stress of COVID-19. Television provided a sanctuary during lockdown for those seeking familiar and “safe” content which offered an escape from the worrying realities of the pandemic.”
An exciting aspect addressed in the survey above is how viewers had behaved in front of the television. Programs previously watched individually became a reason for meetings and debates at home:
They valued companionship much more than before, regularly viewing it at home with other members of their family. TV became more of a talking point – within the household and on social media – allowing a sense of connection. Online streaming services were particularly effective at fulfilling these needs – seen as safe spaces with content that everyone could enjoy (Johnson and Dempsey, 2020).
With all this in mind, I focused on understanding the performance of some channels on linear television and how the same programmes performed on VOD in 2020. As I work in a broadcast company, I have access to tools to show me relevant information. My main thought was about how the viewers watched VOD content when they had plenty of time to watch the same programme on linear television.
A+E NETWORKS UK
I currently work at A+E Networks UK, a broadcast company based in London. As reported on their website:
“A+E Networks® UK, a joint venture between Hearst and Sky, is a leading media network reaching 60 million homes across 100 countries. With our portfolio of popular, high-performing and creative brands - History®, Crime+Investigation®, History2® and UK free to air BLAZE® - we have entertained and inspired audiences for over 20 years; telling the stories that need to be told1.”
The digital portfolio of A+E Networks is getting more significant year by year, and this has always been considered a significant investment in the company (PETERSON, 2020). It is essential to highlight that the A+E Portfolio VOD achieved more space because of the availability of its content on-demand on different platforms in the last year. More retailers, territories and brands were added in 2020, such as Apple TV and Amazon Prime. The number of subscribers tripled in 2020 from 40k to 131k (A+E Networks, 2021).
I thought that it would be interesting to have a case study to illustrate how a specific programme performed in the lockdown period. Below we find a description of this show:
“Kings of Pain follows wildlife biologist Adam Thorn and professional animal handler Rob Caveman Alleva as they get bitten and stung by some of the most dangerous animals and vicious stinging insects in the world – from a reticulated python to a rove beetle – to create a complete and comprehensive pain index that will ultimately help save lives. In 1983, entomologist Dr Justin O. Schmidt began ranking stinging insects on a scale from 1 to 4, putting himself in harm’s way for science, creating the Schmidt sting pain index and authoring the book The Sting of The Wild.”
The following chart shows the non-linear numbers of ‘Kings of Pain’.
- A+E Networks, ‘Who We Are’, at https://www.history.co.uk/shows/kings-of-pain (accessed 05/07/2021)

This programme increased on VOD by just under 1700% following transmission. This can also result from having the content features on Channel 4’s Gogglebox, which had an immediate and significant impact on both VOD impressions and revenue. The website RealityTitbit.com had published the below review when Kings of Pain was featured on Gogglebox:
“The reactors on Gogglebox tend to make sarky remarks or prod fun at what TV networks have to offer, but their reactions to Kings of Pain were something else entirely.
From shrieks of horror to outright shock, they all could not believe what they were watching. Many expletives followed the first snake bite, as you could imagine.
When the Kings of Pain ran the second snake bite experiment, South London’s Sue had to admit: “I do not think I can watch this again.” Stephen Webb uttered: “I cannot keep watching, it is making me feel ill.”’
TOTAL CONSUMPTION METHODOLOGY
Total Consumption is the total audience across all sources of viewing (Anderson et al. 2021). This research aims to look at total consumption across A+E Networks UK. To do this, I have converted the various non-linear sources available to me into ratings equivalent to give one viewer 000s number for our channels using the BARB and Techedge software.
This study illustrates the combination of our linear ratings and non-linear sources converted the total consumption figure.
I have also tracked commercial impacts (linear) and commercial impressions (non-linear), delivered each week, which measures how many commercials were viewed, which is essential because commercials mean revenue.
NON-LINEAR RATING CONTRIBUTION
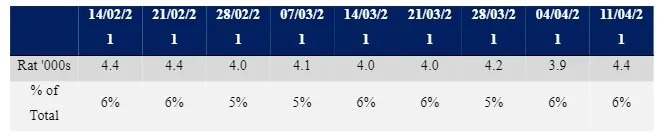
In this section, the table reflects the sum of all the non-linear ratings delivered each week across all the various platforms (i.e. Sky STB, Sky GO, Amazon, Apple and the BLAZE App), and the % represents the contribution this delivers from the total.2
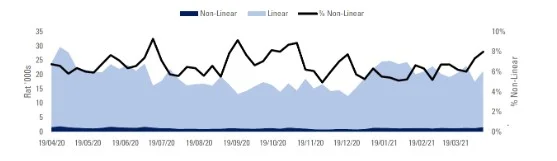
The chart represents the same as the above, with the ability to visualise the contribution in ratings of both parts and how the % contribution of non-linear is tracking over a more extended period (rolling 52 weeks).

VOD PERFORMANCE
I decided to focus on only one channel: The History Channel. Below we find some information about how top series from this channel performed on linear television compared to VOD:

The top VOD events are not similar to the ones broadcasted on television. Forged in Fire, for example, was the most-watched programme on VOD, and it is not on the top three of linear viewing (Krings, 2021).
The same happened on Blaze, a free to air channel with content similar to The History Channel:

Below we can see how was the performance of the non-linear events from April 2020 to March 2021:
The PVODs also had a growth if compared to 2019. PVOD means Premium Video-On-Demand. As soon as the lockdown began, the number of PVOD events grew by 31% on 2020 levels exceeding the company’s target by 25% (Ayanbadejo, 2020).
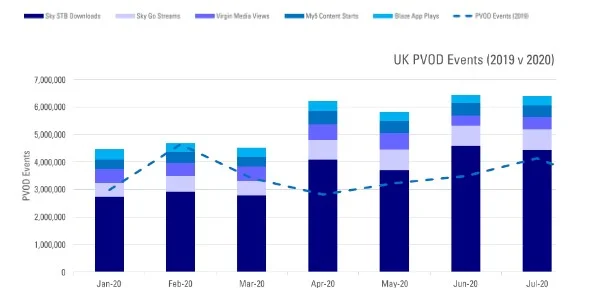
Over 40 VOD schedules are issued each month, but the company drives additional revenue through Sky, Virgin, My5 and the Blaze app performance. Much of the 2020 increase was centred around the first lockdown period in Q1/Q2. The long-term trend has also been one of growth, with VOD events increasing year by year.

SKY HISTORY: DOWNLOADS/VIEWS
What has also caught my attention was the number of downloads of the History Channel content during the lockdown. Even the viewers having more time to watch the content on linear television, as most of the people were at home, the downloads had a substantial growth when compared to 2019 (Mulligan, 2020):

The number of unique users also rose during the first lockdown period.

I finished the research with some subscription and viewers numbers during the first lockdown period on the platform of The History Channel:

The number of subscriptions increased 11% month on month.
There was an increase of 30% on the streams number, an average of 27 minutes per flat, 7.8 million minutes were viewed.
DISNEY+ AND THE LOCKDOWN LAUNCH
On March 23rd, the UK went into lockdown. On March 24th, Disney+ was launched. Not suggesting the two are linked, but it was an excellent fortune for Disney that the UK locked indoors for three months.
In a recent survey, 18% of adults said they currently pay for a Disney+ subscription (LA Times, 2021). Out of all age groups, 16-34s were the most likely to sign up, with 30% of that age group saying they have a Disney+ subscription vs 22% of 35-45 and a tiny 6% of over 55s.
Other 38% of 16-34s said they replaced another service in their house with Disney +, and there are three theories as to why this particular group were so fast to join in the House of Mouse. The first theory is that this group grew up with the golden Disney Renaissance, a decade long stretch or arguably superior Disney animated classics. As we know, nostalgia is a big draw, and loving older Disney/Pixar content was the number 1 reason for 16-34s (23%) to subscribe to Disney+, according to our survey.
The second theory is that this age group now have young children, and the subscription is mainly for them. While this was the number 2 reason for 16-34s with 21% agreeing, it was much more likely that 35-54s would subscribe for their kids, a massive 38% of 35-54s said the subscription was mainly for their children showing that Millennials were more likely to subscribe for themselves than for others classic Millennials move.
The third and final theory is that 16-34s would most likely want access to exclusive Disney+ shows (i.e. The Mandalorian, Be Our Chef and the newly announced Secret Society of Second-Born Royals). This is only proper – 13% of 16-34s said they subscribed for the exclusive content. In fact, 16-34s were more likely to say they subscribed because they love Stars Wars and Marvel content (19%).
LOCKDOWN VS PRODUCTION
Lockdown brought with it a pause to TV Production, but microphones and camcorders were not put down for long (Andueza-Lopez, 2020). An example of that was the Australian soap Neighbours that resumed filming during lockdown with the number of people in scenes cut down, and crafty camera angles had to be adopted to make it seem like actors were together. The production site has been divided into zones with no crew crossover, making it easy to identify the source of an on-set outbreak.
Large-scale productions had it more demanding, to which filming in remote locations might be an answer (Mikos, 2020). However, studios had to embrace production indoors to save on travel costs.
The animation formats were easier to tackle in lockdown, with animators having access to the software from the comforts of home (20th Century FOX embraced story-boarding programme ‘Toon Boom’ for the teams behind The Simpsons and Family Guy). Not to mention a ‘Zoom’ was set up for any voice actor table reads.
Despite a general revival of TV production, some independent production companies faced a bleak future under an extended lockdown. Much of their funding comes internally or through loans until a broadcaster acquires their content. However, with drainage in ad revenue, these same broadcasters find their pockets emptier. Furthermore, delays in filming may result in clashes in production schedules. In such instances, actors might end up having to choose between projects, a damaging prospect if production funding is dependent on specific actors being involved. And then, there was the issue of a lack of COVID-19 insurance (Ali, 2021). According to the (Professor in Media and Communication, University of Huddersfield and Lauren Dempsey (PhD Candidate, University of Nottingham), the lack of production during this pandemic was perceived by viewers, which caused a certain level of discontent:
By contrast, the strong association of public service broadcasting as the go-to source of trusted information made broadcast TV less safe viewing space. Our participants discussed regulating their news consumption because of the emotional distress it caused.
This was exacerbated by a perception that the likes of BBC and ITV were unable to generate new content, ceasing production of beloved soap operas, dramas and sports coverage. These channels became synonymous with repeats and news, driving our participants to seek alternatives from streaming services.
This stark contrast to how participants felt about such channels just a year before. When we first interviewed them in the summer of 2019, most participants associated the BBC, ITV and Channel 4 with high-quality, unique content. Many were habitually engaging with free-to-air channels, keeping track of new releases and making time to enjoy new and plentiful series.
Participants regularly planned their evenings around what is known as “event” TV, placing publicly broadcast live television at the centre of their viewing schedules. However, during the lockdown, even the most committed viewers were exasperated with the limited offerings of the traditional channels. One 67-year-old woman lamented: “They are all repeats!” (Johnson, 2020)
The irony with is pandemic is that TV viewership is at its highest ever, yet the belt around production was never tighter (Dixit et al. 2019). There were hits to both content quantity and quality as production companies returned. The hope was that viewers could continue accommodating when it comes to such limitations.
Viewing habits on the US during the pandemic
The USA also faced a change in their TV viewing habits, and I thought it would also be interesting to address how Americans consumed television during 2020 (Rubenking and Brackenm 2021).
A survey by Nielsen Holdings Incorporation, a piece of American information, data and market measurement firm, showed that during the second quarter of 2020, when the lockdown had much more impact on Americans’ lives, it showed that the country’s economic effect, with thousands of workers losing their jobs, had a significant impact on media consumption:
Streaming Video: Nielsen’s Streaming Meter, a subset of nearly 1,000 streaming capable homes from the National TV panel, reported a sizable increase in streaming video usage in the second quarter of 2020. For the quarter, among all over-the-top (OTT) capable homes, streaming video accounted for 25% of total television viewing minutes, up from 19% from the fourth quarter of 2019. The cumulative weekly time spent with streaming video in the second quarter was 142.5 billion minutes, an increase of nearly 75% from the 81.7 billion minutes during the second quarter of 2019.
During the first few months of the pandemic, two new streaming services were launched, Quibi and AT&T’s HBO Max, providing more video content. According to the Nielsen Remote Worker Consumer survey, 25% of adults added a streaming video service in the past three months, and only 2% of adults reduced the number of paid subscription services. Among ethnic groups, 40% of Hispanics added at least one streaming video service in the quarter
Below we can find some results divided by two different categories:
News: Nielsen found at home news consumption grew significantly in the second quarter. With many TV sets on throughout the day, coupled with late-breaking information, the news was the most popular TV genre viewed. Nielsen found that 47% surveyed had either watched or streamed the news. Other popular genres were comedy at 40% (an escape from the news), movies at 36% and drama at 30%.
The most popular TV news source was local television, with 64% of respondents. Followed closely was national cable news at 62% and national broadcast news at 58%. The ratings for all three news outlets had sharp increases in viewing the second quarter. Conversely, although the pandemic is global, only 22% watched or streamed any international news sources.
Nielsen found there were several different reasons why viewers turned to local news. The top reason was local info (events, crime, announcements, classified, weather) at 61%. Other popular responses were stories relevant to me at 44%, content I trust at 41%, connection to my community at 39% and more time to watch due to working from home at 28%.
Most Common Activities: The most common activities for stay at home workers during work hours were: Listening to music on an AM/FM radio station or streaming services, with 40% listening daily and another 35% at least once a week. During the pandemic, many respondents considered radio to be their “comfort food.” Watching TV or streaming content during a work break was the second most popular media activity; 33% were watching every day and another 32% at least once a week.
Spending time on social media was also a popular activity during work breaks; 31% of stay-at-home workers used social each day, with another 33% at least once a week. With many brick and mortar retailers temporarily closed, 13% of stay at home workers bought a product or service online every day and 48% at least once a week.
According to Peter Katsingris, new behaviours and ways of consuming television and, consequently, the media, were strong during the pandemic and should have their impacts felt for some time in the United States (Adgate, 2020):
The pandemic may have a lasting effect on media consumption. Peter Katsingris notes, “At the beginning of the pandemic in March, as most of America sheltered in place, consumption of all forms of in-home media shot up, especially television and TV-connected device usage. Over time, TV usage levels have inched their way back to pre-COVID levels as peoples’ lives have somewhat “re-normalised,” but with new or tweaked behaviours now in their lives. For example, people who wake up early to begin their morning commute are sleeping in later and going to bed later if they still get to work from home. With less time spent in their car or perhaps on a train, they now have more time to do as they please. Perhaps in the morning, the reading of the news on the train via device has shifted to watching it on a bigger screen at home. With a later bedtime and no morning bus to catch, many have more time to binge content.”
Katsingris continues, “Media habits during the actual workday could permanently shift, too. During the day, with easy access to all sorts of media in your home office, people are simultaneously using platforms more to keep them company at home. Maybe you listen to more music or a podcast for background noise or tune in to what is on TV periodically throughout the day. For media publishers themselves, reaching the consumer and adjusting programming can be a little trickier, as traditional long-time behaviours and trends may shift. However, it is important to know that a remote workforce makes an effort to spend more time with media.”
Katsingris adds, “Looking at the cross-platform viewing habits for those that worked from home before COVID and those that began working from home during COVID; we found that in both instances, this group goes digital (computer/smartphone/tablet). Work-from-homers spend more time on digital platforms as well as TV-connected devices and have a larger share of viewing to digital sources (57%) than other viewing types. Brands and agencies looking to connect with ‘work-from-homers’ have an impetus to reach these consumers where they work, literally, via adjusted digital marketing strategies.”
INDEPENDENT FILMS AND COVID
The pandemic has not only impacted how people consume television. The cinema was also heavily impacted, as it will remain closed for several months (Hanzlik and Mazierska, 2021). Movie theatres that already offer to watch movies online could benefit from this, such as Curzon.
According to an article published on the website Broadcastnow.uk, online film platforms reported a significant increase during the pandemic (Broadcast Network, 2021):
The streamers have all enjoyed a ‘Covid bounce’ this year, which begins to pose existential questions for the cinema industry, given that audiences are potentially getting very comfortable in watching in the comfort of their homes.
Netflix added 2.2m subscribers in the third quarter this year. This is substantially lower than the 15m added in Q1 and the 10m added in Q2, but it does not appear to be churning the subscriber’s whare o in lockdown and now has a global customer base approaching 200m.
“Disney+ now has 60m subscribers and has passed a five-year growth plan milestone in a mere eight months. The media giant has to face many other problems caused by the pandemic, but customer engagement on streaming is not one of them.
More minor, niche providers in the UK, such as BFI Player and Mubi, have also reported massive growth in users (and, more importantly, engagement) on their platforms.
Cloud-based streaming services are easy to join and interact with and are increasingly the best home for premium content outside of the sports arena. It is no wonder that audiences are moving away from satellite TV and cable packages and the cinema for their content needs.”
In addition, the Mubi Film Platform launched a fundraising campaign to help movie theatres during the lockdown and were able to raise a good amount:
“The fund has been started with a £10,000 donation from MUBI, and the campaign aims to raise £100,000. The total raised will be donated to the BFI FAN COVID-19 Resilience Fund, which was set up this month by the BFI and its UK-wide BFI Film Audience Network (FAN) to offer critical relief and business continuity to exhibitors across the UK.
Donations will be used to support independent cinemas, film festivals, and other organisations whose mission to bring fantastic cinema to audiences across the UK is now impossible due to the COVID-19 pandemic. Many of these small and medium-sized businesses are now facing permanent closure. These organisations will range in scale and type, but they all share a passion for the best and broadest in UK and world cinema.
To raise awareness of the initiative and drive further support, MUBI has collaborated with cinemas across London to hire their marquees to display a defiant message of solidarity. Cinema partners include the Phoenix Cinema, which was built in 1910, the family-run Genesis Cinema, which has been central to the arts community since the mid-nineteenth century, the Grade II listed Rio Cinema and Catford Mews, which only opened seven months ago and quickly established itself as a critical community cinema. (The Bigger Picture, 2020)”
In addition to that, the founder of Mubi, Turkish cinephile and entrepreneur Efe Cakarel said in an interview dated December 2020 that the platform reported significant growth during the pandemic (MUELLER, 2020):

“The kind of growth that we have had, which reflects very positively on our financial health. MUBI is a cash flow-positive company now, and we will invest a significant chunk of that towards producing our content. It is an ambitious plan, and it is going to take us a good five years to start humming. Nevertheless, as I said, it is essential. You cannot rely on licensing Parasite from Curzon if you want to survive. You want to be making Bong Joon Ho’s next film. Furthermore, that is our world: when he won the Oscar, on his way back to Korea from LA, he stopped in London, and what did he do that night? He came to a screening with us and hung out with the MUBI team. That is our world. There is no reason why we cannot develop the capabilities to produce a film like Parasite in the coming years.”
CONCLUSION
Based on what was shown in this research, I can affirm that the habits of the History Channel viewers have been changing since March 2020, when the entire world was affected by the Covid pandemic. The first lockdown forced people to stay at home with few entertainment options available (Sheth, 2020). Some programmes appeared to be more attractive on non-linear options than others, even when people had plenty of time to watch them on the transmission day.
From the beginning, what caught my attention the most was the fact that many people, even though they were 100% of the time at home and, therefore, being able to watch their favourite programs when they were shown on television, they still preferred to watch the same shows on non-linear platforms This may have led to this that nowadays we are used to having different options for many things at all times. Furthermore, the fact of being connected to a platform that gives you the option of when and how watching a particular program, among many others available to me, could have been a big difference. The power of choice may be thought of as a determining factor in consuming television (Sultana, Tasnim and Hossain, 2021).
As linear TV viewing returns to normal levels, new habits have already been formed, and, likely, some of those changes are here to stay (Kim et al. 2021). We move forward into this weird new normal, but we take with us a clearer vision for the future of this beautiful business.
Another vital factor to be considered is the growth of subscribers on online cinema platforms. Perhaps this will prove more present over the next few years, as many people may have become accustomed to the convenience of watching movie releases from the comfort of their own homes.
BIBLIOGRAPHY
- A+E Networks, 2021. Who We Are. [online] Available at: https://www.aenetworks.tv/who-we-are [Accessed 16 December 2021].
- Adgate, B., 2020. Nielsen: How The Pandemic Changed At Home Media Consumption. [online] Forbes. Available at: https://www.forbes.com/sites/bradadgate/2020/08/21/nielsen-how-the-pandemic-changed-at-home-media-consumption/?sh=6483fb725a28 [Accessed 16 December 2021].
- Ali, H., 2021. The Impact of Covid-19 in Film Industry of Pakistan.
- Anderson, D., Sweeney, K., Pasquini, E., Estes, B. and Zapalac, R., 2021. An Exploration of Esports Consumer Consumption Patterns, Fandom, and Motives. International Journal of eSports Research (IJER), 1(1), pp.1-18.
- Ayanbadejo, M., 2020. How has COVID-19 impacted the evolution of cinemas. General Management in Lockdown, pp.1-6.
- Azhar, S., Morris, B., Casey, R. and Guillot, S., 2021. The Impact of the COVID-19 Pandemic on Subscription Video-On-Demand Services.
- BBC. 2020. TV watching and online streaming surge during lockdown. [online] Available at: https://www.bbc.co.uk/news/entertainment-arts-53637305 [Accessed 16 December 2021].
- Broadcast Network, 2021. Pandemic puts SVoDs in charge. [online] Available at: https://www.broadcastnow.co.uk/futureofcontent/pandemic-puts-svods-in-charge/5154395.article [Accessed 16 December 2021].
- Dixit, A., Marthoenis, M., Arafat, S.Y., Sharma, P. and Kar, S.K., 2020. Binge watching behavior during COVID 19 pandemic: a cross-sectional, cross-national online survey. Psychiatry research, 289, p.113089.
- Edwards, E., 2021. Kings of Pain snake bite scene shocks Gogglebox viewers - how to watch in the UK!. [online] Reality Titbit. Available at: https://www.realitytitbit.com/channel-4/gogglebox/kings-of-pain-snake-bite [Accessed 16 December 2021].
- Feldmann, A., Gasser, O., Lichtblau, F., Pujol, E., Poese, I., Dietzel, C., Wagner, D., Wichtlhuber, M., Tapiador, J., Vallina-Rodriguez, N. and Hohlfeld, O., 2021, March. Implications of the COVID-19 Pandemic on the Internet Traffic. In Broadband Coverage in Germany; 15th ITG-Symposium (pp. 1-5). VDE.
- Hanzlík, J. and Mazierska, E., 2021. Eastern European film festivals: streaming through the covid-19 pandemic. Studies in Eastern European Cinema, pp.1-18.
- Johnson, C. and Dempsey, L., 2020. How coronavirus might have changed TV viewing habits for good – new research. [online] The Conversation. Available at: https://theconversation.com/how-coronavirus-might-have-changed-tv-viewing-habits-for-good-new-research-146040 [Accessed 16 December 2021].
- Johnson, P., 2020. How coronavirus might have changed TV viewing habits for good - new research. [online] Available at: https://www.hud.ac.uk/news/2020/november/how-coronavirus-changed-tv-viewing-c-johnson/ [Accessed 16 December 2021].
- Kim, B., Yoo, M. and Yang, W., 2020. Online engagement among restaurant customers: The importance of enhancing flow for social media users. Journal of Hospitality & Tourism Research, 44(2), pp.252-277.
- Kim, J., Merrill Jr, K., Collins, C. and Yang, H., 2021. Social TV viewing during the COVID-19 lockdown: The mediating role of social presence. Technology in Society, 67, p.101733.
- Krings, E., 2021. VOD Streaming – What It Is and How it Works with OTT [2021 Update]. [Blog] dacast, Available at: https://www.dacast.com/blog/vod-streaming/ [Accessed 16 December 2021].
- Mikos, L., 2020. Film and television production and consumption in times of the COVID-19 pandemic–the case of Germany. Baltic Screen Media Review, (8), pp.30-34.
- MUELLER, M., 2020. Perspectives on 2020: Efe Cakarel on MUBI’s boom and shattered windows. [online] SCREEN DAILY. Available at: https://www.screendaily.com/features/perspectives-on-2020-efe-cakarel-on-mubis-boom-and-shattered-windows/5155855.article [Accessed 16 December 2021].
- Mulligan, T., 2020. Historical and Crime Dramas Are Dominating Lockdown Viewing. [online] MIDIA. Available at: https://www.midiaresearch.com/blog/historical-and-crime-dramas-are-dominating-lockdown-viewing [Accessed 16 December 2021].
- Ni, D., Liu, X. and Zheng, X., 2021. How and when does service performance improve positive emotions? an employee–customer social exchange perspective. European Journal of Work and Organizational Psychology, pp.1-16.
- PETERSON, T., 2020. How A+E Networks is building a portfolio of free 24/7 streaming channels. [online] DIGIDAY. Available at: https://digiday.com/future-of-tv/how-ae-networks-is-building-a-portfolio-of-free-24-7-streaming-channels/ [Accessed 15 December 2021].
- Rubenking, B. and Bracken, C.C., 2021. Binge watching and serial viewing: Comparing new media viewing habits in 2015 and 2020. Addictive Behaviors Reports, p.100356.
- Schanke, S., Burtch, G. and Ray, G., 2021. Estimating the impact of “humanizing” customer service chatbots. Information Systems Research.
- Sheth, J., 2020. Impact of Covid-19 on consumer behavior: Will the old habits return or die?. Journal of business research, 117, pp.280-283.
- Sultana, A., Tasnim, S., Hossain, M.M., Bhattacharya, S. and Purohit, N., 2021. Digital screen time during the COVID-19 pandemic: A public health concern. F1000Research, 10(81), p.81.
- The Bigger Picture, 2020. Article: MUBI launches fundraising campaign to support cinemas in the UK through BFI FAN COVID-19 Resilience Fund. [online] Available at: https://www.the-bigger-picture.com/articles/mubi-fundraising-campaign/ [Accessed 16 December 2021].
- Yuan, Y., Wang, X. and Bin, G., 2020, January. Analysis of user behavior in a large-scale internet video-on-demand (VoD) system. In Proceedings of the 5th International Conference on Multimedia and Image Processing (pp. 153-158).
Continue your journey with our comprehensive guide to Theory of News Values in Agenda Shaping.


- 24/7 Customer Support
- 100% Customer Satisfaction
- No Privacy Violation
- Quick Services
- Subject Experts