Strategic Choices in Research Approaches
Research Design
Bryman (2008) defines a research design as the systematic approach taken by a researcher to achieve the objectives of any scientific study. Basically, it embodies an overall synchronization of various components if the research process to develop conclusive results of the study. According to Creswell (2017), researchers are expected to make a strategic choice of research design by ensuring that it resonates with the topic under investigation. In doing so, researchers have a range of research designs to choose from, including explanatory research design, descriptive research design, and evaluation research design. Considering the nature of the current study’s topic, explanatory research design emerges to be the best choice. Basically, the current study seeks to understand the explanation behind an increased voter turn-out in the UK’s 2015-2017 parliamentary general elections. Hence, we are interested in answering the question of ‘what’, ‘why’ and ‘how’.
De Vaus (2013) insists that the explanatory research design is suitable for studies that are focused on explaining the aspects of the phenomenon under investigation in a detailed manner. Hence, the researcher begins with a general idea/assumptions/hypothesis and uses explanatory research tools to provide more details on the idea, and even provide further information about it. In the current study, the researcher has theorized/hypothesized that the increasing left-right polarization, climaxed by the Brexit divide, were the main reason for the increased voter turnout in the UK’s 2015-2017 parliamentary general election. Therefore, the researcher aims to use the exploratory research design to test this hypothesis/theory that the spike in election participation was as a result of parties moving toward left and right wings of their bases (i.e. labour party more left wing while conservative party more right wing); and that the increased divide between the ‘leave’ and ‘remain’ divides in the Brexit debate also triggered more voter turnout.

The Actual Research Approach
In addition to experimental and survey research approaches, researchers also have the option of cross-sectional and longitudinal research approaches that they can use. Ideally, whereas all these approaches offer measurements and observations on various variables, researchers need to be strategic on the approach they use. However, first, there is a need to understand the difference between some of the two major ones. Denscombe (2017) explains that longitudinal research approach entails making observations on the key characteristics of the same phenomenon under investigation through a long period of time, while in cross-sectional studies; the researcher is dealing with cohorts or categories of data over time to make observations. Therefore, cross-sectional research approach allows for the study of the phenomenon over a longer period of time without actually taking such a long time (Ritchie & Lewis, 2004). The aim of the current study is to investigate why there was a spike in voter turnout in the UK’s 2017-2017 parliamentary general election, with an assumption that increased polarization between the right and left political wings could have led to the spike. Hence, the cross-sectional research approach emerges to be the best option of the current study because it will allow the researcher to easily deal with different categories of already existing voter turnout data in the period of 2015-2017 to confirm or invalidate the hypothesis. In short, the researcher deems cross-sectional research approach as the most appropriate for the current study because data from the British Election Study to analyse the impact of competing explanations on the 2015-2017 voter turnout. Implementing a cross-sectional research approach will also come along with several other advantages. For example, the researcher will be able to quickly collect the necessary data (Talman, 2007). Besides, according to Moonie (2003), cross-sectional research approach allows researchers to use study more variables than they can be able to study with a longitudinal research approach.
Due the use of both explanatory and cross-sectional research designs in the current study, the researcher will, therefore, take a quantitative research design to achieve the research objective. First, scientific studies can either be qualitative or quantitative. The qualitative research design is generally explorative in nature and is useful in gaining the opinions, motivations, and reasons behind the phenomenon under investigation (Stretch, 2002). They help researchers in developing ideas or hypotheses for potential quantitative research. On the other hand, according to Thomas (2015), quantitative research design is used to generate numerical data to enable the quantification of the problem by generating facts and unveiling patterns in the process of making inferences from the data. In the current study, the researcher aims to use data from British Election Statistics to confirm the hypothesis that that increased polarization between the right and left political wings could have led to the spike of voter turnout in the UK’s 2015-2017 voter turnout. Voter turnout is always measured in quantitative terms and therefore there is a need for the researcher to establish quantities involved in voter turnout upon the speculated increase in polarization of UK’s left and right political divides. The use of quantitative methods will, therefore, enable the researcher to make various inferences from the British voting population, in an attempt to confirm or invalidate the hypothesis. Therefore, in simple terms, quantitative methods will be used to quantify the voter turnout behaviour that emanates from an increasing polarization of UK’s conservative and liberal parties, as well as the leave or remain pacts in Brexit debate.
Target Population and Sampling
The study targets the British voting population and the sample size will be equal to those already derived by the British Election Statistics (BES) 2015-2017. Hence, the study will rely on the 6072 sample population applied in the 2015 BES, and the 2198 sample size applied in the 2017 BES. Relying on a representative sample of British voters is especially helpful because it would be impossible to involve all the eligible voters in the UK into the study (Stretch, 2002). Besides, based on literature by Moonie (2003), it would be expensive, time-consuming, and impractical to rely on the entire voting population. Consequently, the study will apply the random probability sampling for the 2015 BES data while for the 2017 BES, random stratified sampling method will be applied. In the case of 2015 BES, random probability sampling will be used to select voters from 300 parliamentary constituencies in Wales, Scotland, and England. As opposed to an online survey, the study relied on a face-to-face survey to achieve the representative sample and this yielded the 6072 sample population applied in the study (BES, 2017). On the other hand, for the 2017 BES, the study relied on a multi-stage sample selection design that included a stratified random sample of 243 Parliamentary constituencies, selection of an address from user postcode address, and a random selection of one individual from each address. In regards to the selection of samples from parliamentary constituencies, there was a stratification of constituencies by region and by country based on what was earlier known as Government Office Regions. In each region, the constituencies are stratified by party competition i.e. a combination of party competition and winning party in the 2010 elections. The constituencies are then sorted from the most to the least marginal within each cell, and then selected based on a probability proportional to the population size. The selection of addresses involved a sampling of each address from the PAF using a random start and fixed sampling interval. Finally, in regards to the selection of individuals, the number of households, dwellings and people aged 18 years or above were identified from each address. A Kish grid was then used to select one individual from each randomised address.
In the backdrop, this study solely relies on data from the BES to achieve its objectives. As such, it is monumental to review BES as in regards to what other scholars and researchers say about its validity and reliability. Against this backdrop, the BES is currently one of the oldest running election studies in the world and has been marvelled to have made a significant contribution to the political behaviour of the British electorate (University of Manchester n.d). Besides, according to (www.britishelectionstudy.com), the statistics bureau has generated various sources and types of data for the past 50 years, enabling students, politicians, academics, and journalists to gain a proper understanding of the British political landscape. It is a massive piece of work that helps the British population, and by extension, the global population understands how British democracy is functioning. After each general election in the UK, BES tries to find out what informed the voters’ decision to vote the way they did (www.britishelectionstudy.com). This makes the BES among the Best sources of data for use in the current study, which essentially seeks to understand why there was a spike in voter turnout in the 2015-2017 UK Parliamentary General Elections.
Variables, Measurement, and Operationalization
The main aim of this study is to establish why there was a voter spike in the 2015-2017 UK parliamentary General Elections, with a speculation that an increase in polarisation between the liberals and the conservatives as well as the Brexit Leave and Remain pacts could have contributed to such as spike – but other intervening variables such as cost of voting and type of elections are up for consideration. Hence, the study intends to test whether there is a relationship between an increase polarisation and increased voter turnout. Consequently, we end up with the following conceptual framework:
Hypothetical Conceptual Framework
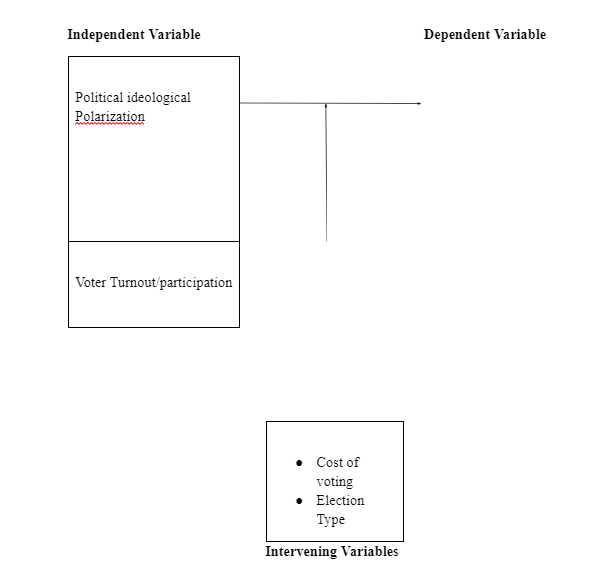
As illustrated above, the dependent variable is voter turnout while the independent variable is political-ideological polarization, with intervening variables such as the cost of voting and election type. According to www.britishelectionstudy.com, voter turnout/participation refers to the percentage of eligible voters who cast their ballot in the parliamentary general election. In the UK, an eligible voter is anyone who is 18 years or above as at the polling day, a British citizen, an Irish citizen or any qualifying Commonwealth citizen (www.britishelectionstudy.com). This percentage is calculated by dividing the actual number of voters in that particular election by the number of registered voters –usually a measure of each parliamentary constituency and each region within the whole country (www.britishelectionstudy.com). This measure of voter turnout is reliable because it is always possible to obtain the correct number of actual voters in an election and the number of registered voters to measure voter turnout. However, the number of registered voters may increase from one election to another due to more people registering; or decrease due to factors such as the death of registered voters. In regards to validity, this measure is valid because only the registered voters are allowed to vote, and therefore to determine the level of voter turnout, there is a need to establish which percentage of the registered voters actually turned up to vote.
Party ideology polarization has somewhat been complex to measure and operationalize. According to Schmitt (2016), part of the reason for this complexity is that there seems to be no well-known or undisputed concept of party polarization, especially because polarization itself has various explicit theoretical aspects that are often difficult to consider during operationalization. However, Schmitt (2016), in a multi-party democracy context, conceptualizes polarization as the ideological distance between parties, i.e. how the ideological spectrum is generally spread within a given polity. Several other studies such as Dalton (2008) Kim et al (2010) and Han (2015) have used the same conceptualization of polarization as the degree to which various political parties within a system of democracy differ in ideologies. The present study will also adopt the same conceptualization.
Models and Actual Statistical Approach
In order to measure the degree of polarization, the present study will use the model proposed by Dalton (2008) as:
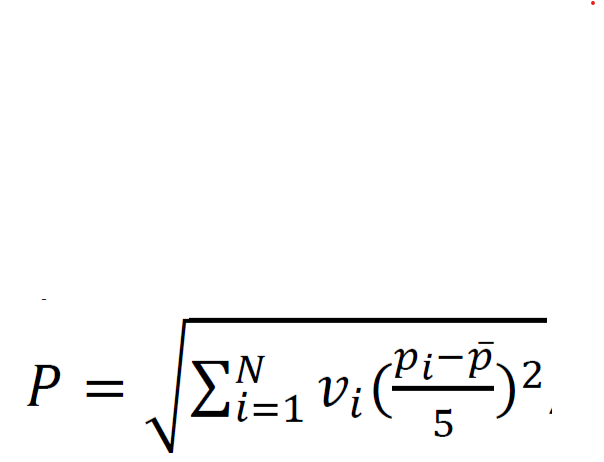
Where V=vote share, p=party position, and N=number of parties.

Ultimately, the study will use binary logistical regression to test the relationship between the variables. According to Bryman (2008), binary logistical regression is a form of linear regression that is often used when the dependent variable is binary/dichotomous, e.g. low or high (as in the case of voter turnout). It is used to predict the relationship between the dependent and independent variables within one block while at the same time controlling for the effect of other controlling variables in the model. Therefore, the present study will use binary logistic regression to predict the relationship between independent variable (political ideological polarization) and the dependent variable (i.e. voter turnout) while controlling for other variables such as the cost of voting and type of election.
References
Bryman, A (2008) Social Research Methods. Oxford: Oxford University Press.
Creswell, J.W. (2017) Qualitative Inquiry and Research Design: Choosing Among Five Approaches. London. Sage.
Dalton R. (2008) the quality and the quantity of party systems: Party system polarization: How institutions and voters matter. The journal of politics 74(02): 460-73.
Denscombe, M. (2017): The Good research Guide for Small Scale Social Research Projects. Maidenhead: Open University Press.
Han, S. (2015) Income equality, electoral systems and party polarisation. European Journal of Political Research 54(3): 582-600.
Ritchie, J and Lewis, J. (2004) Qualitative Research Practice: A Guide for Social Science Students and Researchers. London. Sage.
Schmitt J. (2016) How to measure ideological Polarization in party systems. Social Sciences Institute-Comparative politics, Heinrich Heine University.
Talman, H. (2007) Research Methodology in Stretch B & Whitehouse M. Health and social Care. Oxford. Heinemann.
Kim H. et al (2010) Electoral systems, party systems, and ideological representation: An analysis of Distortion in Western Democracies. Comparative Politics 42(2): 167-85.
Thomas, D. J (2015) Introduction to Secondary Research Writing . Saraburi: ERT Group.


- 24/7 Customer Support
- 100% Customer Satisfaction
- No Privacy Violation
- Quick Services
- Subject Experts