Demand Petroleum Different Countries
Petroleum price and quantity scatter graphs for each country:
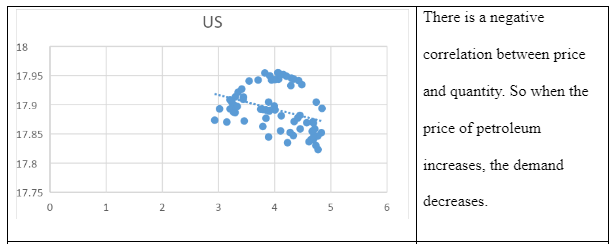


Demand estimations for each country using the regression analysis from the scatter graphs:

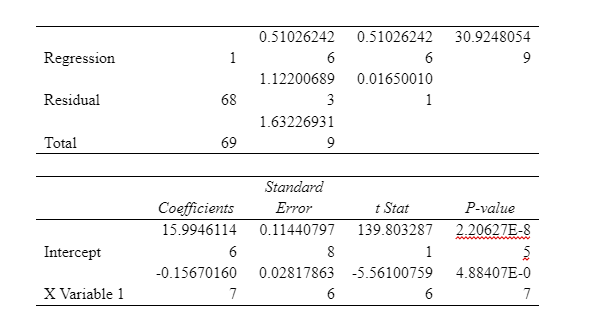
The OLS model is important in explanation of the own-elasticity of the commodity in that, the model enables us to be able to estimate the response of the corresponding quantity as per the unit change in the price per unit (Cardozo, García-Palomares and Gutiérrez 2012, p. 549). In relation to the regression equations and the corresponding scatter plots, only Canada and S. Korea showed a different regression output relation between the variables Quantity demanded (Q) and Price (P) with a positive correlation depicted by a positive regression equation.
As per the modeled regression equations, see table 1, Germany (coefficient =-0.08), and UK (coefficient=-0.067) are the two countries with the law of demand where a unit increase in the price per barrel, there is a corresponding decrease in the quantity demanded


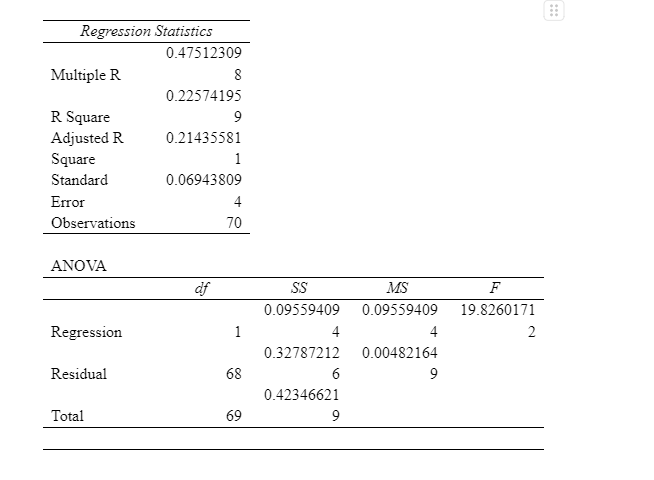
The regression model as shown above shows that only in South Korea is the model insignificant S.KOREA(p=0.918) therefore the regression coefficient is assumed to be equal to 0. All other countries, the regression model is significant in prediction the data.


Based on the multivariate analysis estimation of the demand of petroleum, looking at the output of the regression analysis we deduce that an increase in price would result in -0.117 decrease in the demand, whereas a unit increase in Coal & Gas prices there is a 0.124 increase in the petroleum demand. Also noted is that a unit increase in income will result in 0.380 increase in the demand of the petroleum. These findings are in agreement with the demand and supply theory as expected.

The petroleum price (orange line) increases at a consistent rate then drops by 2008 just when it reaches its peak. This may have been due to the 2008 global recession. The petroleum price then recovers over the next 3 years as it nearly reaches the peak price from 2008 again. The price then declines from then on, with a dramatic fall in 2014 until 2016. The 2014 fall in oil prices was caused by many reasons; countries such as China, India and Brazil, who had a big impact on the price spike until 2008, stopped buying a lot of petroleum in 2014, contributing to the price drop. USA started fracking as well in 2014, so demanded less. The quantity consumption level (blue bar graph) stays at relatively consistent level with increase until 2008 and a slight drop which levels out and nearly stays that way until 2017. It stays at a consistent level as oil is price inelastic. These explanations are relevant to all the countries.
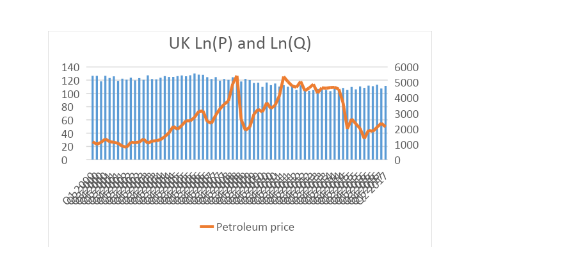
The petroleum price, increases at a consistent rate and then dramatically drops again in 2008 as with all the other countries. It then recovers over the next few years and stays at a consistent level until
Continue your exploration of Under-Five Mortality with our related content.
the price drops hugely again in 2014 until it starts to recover in 2016. The quantity consumption stays at a consistent level until 2008 when it starts to fall slightly.
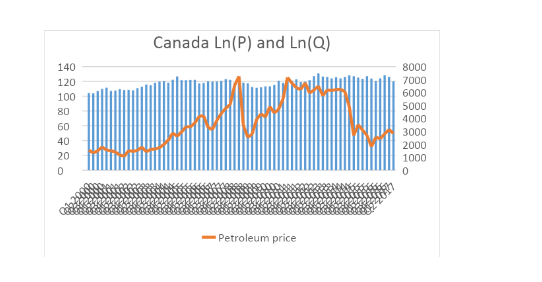
The petroleum price increases at a consistent level as well until 2008 when the global recession made the price drop dramatically. The country then recovers through the next few years and stays consistent until a big drop again in 2014, which then recovers in 2016. Canada also started fracking in 2014. The quantity consumption stays at a consistent level while gradually increasing. There was less of an effect on Canada’s consumption of petroleum with the 2008 recession.

The petroleum price gradually increases until the 2008 recession resulted in a big price drop. The price recovered until a big drop in 2014, which started to recover by 2016. The quantity consumption level stays at a consistent level while gradually decreasing until 2017.

The petroleum price gradually increases until the 2008 recession which made the price drop. The price then recovered until the 2014 drop. The country then recovered by 2016 as prices started rising again. The quantity consumption also stayed at relatively consistent levels while gradually decreasing.

The petroleum price gradually increases until the 2008 recession. The country then recovers well over the next few years with rising prices, and then a large drop in 2014 occurred. Prices started to recover in 2016. The quantity consumption gradually decreased to very low levels in Italy buy 2017.

The price gradually increases until the 2008 recession where a big drop occurred. Japan has very high price levels for petroleum compared to all the other countries. The price then increased and levelled out until another drop in 2014. Prices were still very high compared to other countries even with these price drops. The consumption levels fluctuated a lot in Japan while gradually decreasing.

The price of petroleum in South Korea gradually increased until the 2008 recession where they dropped. Prices in South Korea were still high like Japan. Prices then recovered and dropped again in 2014 and then gradually recovered by 2017. The quantity level fluctuated while gradually increasing by 2017.


R squared shows how close the data is to its fitted regression line. The 29.3% explains that very little of the variability of the response date around its mean. Adjusted r squared helps to stop r squared increasing or decreasing with the addition of more variables that don’t have any relationship with output variables. Adjusted r squared is 28.3%, which is smaller than the r squared as it has taken away any variables that are not related to the dependant variable.
Canada






inelastic, so you would think that if the owner increases his prices, consumers would still buy the same amount of petrol for their cars and not choose other substitutes (Matsumura and Ogawa 2012, p. 176). This is not the case as the price of petrol is determined by the market and all petrol stations change their price to the same amount. If the small chain decides to increase their prices above other larger competitors, consumers will easily go to other petrol stations that are charging the lower price. The demand for petrol is price inelastic but this is for the whole market, not for individual companies. This is called competitive pricing, where you determine your price depending on what the competition is charging (Thimmapuram and Kim 2013, p. 394). So this is not the best strategy to try and increase profit for the small chain owner.
Price elasticity of demand is a measure of how much the quantity demanded of a good responds to a change in the price of the good (Rassenfosse and Potterie 2012, p. 58). Inelastic demand is when the response to the change in price is greater than the change in demand. Petrol is a necessity for people who own cars and they will always need it. Petrol prices change regularly in the UK market and consumers still demand the same irrespective of the price as they can’t change their habits immediately. People need petrol to get to work and carry out everyday tasks that cannot be done without petrol for their car, so understandably consumer can’t put their lives on hold if there is a change in price of petrol in the market. The PED is at -0.07 and highly

Inelastic demand is when demand is less than 1. An increase in price leads to a decrease in quantity demanded. The steepness of the demand curve indicates the PED.
The decrease in supply of crude oil by OPEC would cause an increase in equilibrium price and a decrease in the equilibrium quantity of crude oil. The decrease in supply creates an excess demand at the initial price and the excess demand causes the prices to rise (Rios, McConnell and Brue 2013). Alternatively, a decrease in demand will cause a reduction in the equilibrium price and quantity of a good. The decrease in demand causes excess supply which causes the prices to fall. Although, as the demand for crude oil is predicted to decrease at the same time as the supply of crude oil, there would be a decrease in the supply and demand of crude oil at the same time, which decreases the equilibrium quantity.

The resulting equilibrium goes from Q1 to Q2 with a decrease in demand and supply. Buyers of crude oil want to buy less and sellers want to sell less, so the quantity decreases. Price is unchanged at P1, which is the original equilibrium price. However, this is just an example where the demand and supply shift by the exact same amount. If OPEC decreases the supply of crude oil and the prediction that demand for crude oil will decrease is correct, then the price could end up higher or lower than the original price, as it is very unlikely that supply and demand will decrease by the exact same amount (Marschak and Selten 2012). If demand decreases by a slight amount more, then the price will be higher and vice versa. Because we don’t know how much supply and demand will shift by, we cannot determine if the price of crude oil will increase or decrease.
A buy one get one free deal is buying one book for a normal price then getting another one for free, which can be seen as the same as a 50% off deal and a simple price reduction in terms of money received by the business. A price reduction discount like a 50% off deal reduces the price of each unit purchased by the consumer but a buy one get one free deal only applies when the consumer purchases a second unit (Becerra, Santaló and Silva 2013, p. 73).

The consumers’ budget line of £100 is connecting points A and B, in equilibrium at point C. Point C represents something smaller in price than a book that the business sells e.g. a magazine. The buy one get one free deal lies on ADEF. If the consumer buys less than one book, the buy one get one free deal is not offered so the budget line stays at AD. If the consumer does buy one book, they receive a second book for free and the budget line becomes DEF. The consumer can now buy one extra unit of a book now than they could before, as one of the books is free. So if the consumer decides to buy another book on top of the buy one get one free deal, the budget lines goes to the line between points E and F. The opportunity set increases after the deal is offered and goes to point E, which is now affordable with the money saved (Abrate, Fraquelli and Viglia 2012, p. 163). This is a sales technique that could attract the consumer to buy more books.
A 50% off discount reduces the price of a single book from £50 to £25. The reduction in the price of a book changes the slope to make it flatter than the initial budget line. Since the maximum amount of other goods that can be purchased is Y1, this does not change when there is a decrease in the price of books from X1 to X2. The consumer now has more money to spend and can now buy one extra unit of a book now than they could before. The maximum amount of books a consumer can buy now increases to X2. So the overall effect of a 50% discount is a shift of a new budget line to the right

The 40% discount rate may only have been offered to the consumer after they rejected the buy one get one free deal as the company could be low on sales and needs to find ways to sell as many books as possible to reach a certain level of revenue. The consumer may have no need for a second book and are fully satisfied with buying one book, which implies why the consumer just wanted a 50% discount on the one book. The clerk may have been reluctant to go below half price for the book which is £25, but once the consumer didn’t want to negotiate anymore the clerk will have to get something for the book rather than nothing and offered 40% which is £30 for the book. This may suggest that the clerk has been told by high level management to not go below £30 for a single book that may put the company in a bad sales position.
The clerk may have only been willing to offer a buy one get one free deal but not a half price deal as the business may have to offload as much stock as possible. Stock levels in the business may be far too high and the business still needs to make a profit by selling the stock at a reasonable price. The buy one get one free deal will generate £50 worth of sales as well as selling more books, whereas a 50% discount generates £25 worth of sales and selling only one book, even though selling two books at this price will still come to £50. The clerk may have been told by high level management to get as much money out of each individual consumer as possible and to offload as many books as possible. Selling two books for £50 from one consumer is much more efficient than selling one book to a single consumer for £25 (Ethier 2014, p. 83).
Firing the latest employee seems like it’s the most reasonable as they have been with the business for the shortest time and it seems to avoid complication. Especially if the latest employee’s performance level is lower than an employee who has worked for the business longer. It would be unfair if the latest employee had a greater performance level than other employees in the business that have been there for longer. Although, the business has to make sure they are following company policy, i.e. the business should make sure the employee has been given enough time to prove themselves and management should also have warned the employee about their contribution to overall output before firing the employee as they don’t want to be involved with trade unions if the employee feels they have been unfairly let go (Ruttan and Thirtle 2014).

References
- Abrate, G., Fraquelli, G. and Viglia, G., 2012. Dynamic pricing strategies: Evidence from European hotels. International Journal of Hospitality Management, 31(1), pp.160-168.
- Becerra, M., Santaló, J. and Silva, R., 2013. Being better vs. being different: Differentiation, competition, and pricing strategies in the Spanish hotel industry. Tourism Management, 34, pp.71-79.
- Cardozo, O.D., García-Palomares, J.C. and Gutiérrez, J., 2012. Application of geographically weighted regression to the direct forecasting of transit ridership at station-level. Applied Geography, 34, pp.548-558.
- Ethier, W.J., 2014. National and international returns to scale in the modern theory of international trade. In THE FLOATING WORLD: Issues in International Trade Theory (pp. 77-93).
- Marschak, T. and Selten, R., 2012. General equilibrium with price-making firms (Vol. 91). Springer Science & Business Media.
- Matsumura, T. and Ogawa, A., 2012. Price versus quantity in a mixed duopoly. Economics Letters, 116(2), pp.174-177.
- Rassenfosse, G.D. and Potterie, B.V.P.D.L., 2012. On the price elasticity of demand for patents. Oxford Bulletin of Economics and Statistics, 74(1), pp.58-77.
- Rios, M.C., McConnell, C.R. and Brue, S.L., 2013. Economics: Principles, problems, and policies. McGraw-Hill.
- Ruttan, V. and Thirtle, C., 2014. The role of demand and supply in the generation and diffusion of technical change (Vol. 21). Routledge.
- Thimmapuram, P.R. and Kim, J., 2013. Consumers' price elasticity of demand modeling with economic effects on electricity markets using an agent-based model. IEEE Transactions on Smart Grid, 4(1), pp.390-397.
Continue your journey with our comprehensive guide to Defect Forecasting.
- 24/7 Customer Support
- 100% Customer Satisfaction
- No Privacy Violation
- Quick Services
- Subject Experts


