Examining SAR Data for Flood Mapping
Option B critical review
This critical review aims to assess the journal article, which was conducted by Sandro Martinis and Christoph Rieke to analyse backscatter behaviour by using multi-temporal and multi-frequency Synthetic Aperture Radar (SAR) Data in the Context of Flood Mapping at River Saale in Germany. The research paper was published in 11 June, 2015 and its main purpose is to investigate the backscatter performance of several semantic classes with focus on partially submerged forests and agricultural fields. Time-series of 39 TerraSAR-X data was used within the time from 17 December 2009 to 9 June 2013. The study area was affected by two inundations in January, 2011 and June, 2013. Two wavelength bands were utilised to supplement the data, which are ALOS PALSAR L-band and RADARSAT-2 C-band. For students seeking environmental studies dissertation help, this article is going to provide valuable insights related to the application of SAR data for flood mapping and analysis.
The title of the journal gives clear and brief information about the study. It includes the aim, data and system used and the location. The title objective matches the statement of purpose in the abstract as well as in the end of the introduction. The introduction provides a sequence of information that clearly describes the fundamentals and data used. This includes the benefits of using SAR, the performance of different wavelength bands, incident angle influence and the advantage of using multiple polarizations.

The paper provides aerial photographs of the study area and some elements were considered such as elevation, soil type, climate and growing seasons. Some reference data sets were utilised for validation purposes, such as water level data, high resolutions LiDAR-DEM, in-situ photographs and CIR aerial optical imagery on 17 January 2011. The data processing utilised were SAR-Calibration, speckle-filtering and image registration. SAR data sets were converted to sigma nought values (dB) to ensure that, the images derived from different sensors and acquisition modes can be compared statically. A 3x3 median filter was used as a speckle-filtering, because it preserves the edges and reduces the high frequency. Six distinctive object classes were chosen for statistical analysis of the time series. For each test class, the mean, median, minimum, maximum value and standard deviation were obtained for comparison and interpretation. This study’s method tries to detect the flooded areas in different objects and environments unlike the method used in Kuenzer et al. (2013), which only detects the visible flooded area.
The results of each class are clearly presented in graphs showing the mean and standard deviation of backscatter values. The maximum and minimum values can be easily found from the figures, as the mean and standard deviation values are connected by continuous and dashed lines. The results are explained in the same section. The significant trends and anomalies are repeated in the discussion to highlight this to the reader. Additionally, the effects of the system and environmental parameters on the scattering process are considered. This study obtained high backscatter values in flooded vegetation during leaf-off season due to strong double bounce scattering and this was confirmed by findings of previous studies (Pulvirenti et al., 2013; Voormanasik et al., 2014; Martinis et al., 2015).
In conclusion, this study has examined the ability to detect the flooded area beneath vegetation by monitoring several test areas. The contribution of this study is rather limited, as it utilised the existing methods from previous studies. This study could also not detect the flooded vegetation in dense deciduous forests during the leaf-on season.
References:
1. Martinis, S.; Kuenzer, C.; Twele, A. Flood Studies Using Synthetic Aperture Radar Data. Remote Sensing of Water Resources, Disasters and Urban Studies; Taylor and Francis: London, UK, 2015.
2. Pulvirenti, L.; Pierdicca, N.; Chini, M.; Guerriero, L. Monitoring flood evolution in vegetated areas using COSMO-SkyMed data: The Tuscany 2009 case study. IEEE J. Sel. Top. Appl. Earth Obs. Remote Sens. 2013, 99, 1–10
3. Voormansik, K.; Praks, J.; Antropov, O.; Jagomägi, J.; Zalite, K. Flood mapping with TerraSAR-X in forested regions in Estonia. IEEE J. Sel. Top. Appl. Earth Obs. Remote Sens. 2014, 7, 562–577.
4. Martinis, S., Rieke, C., 2015. Backscatter analysis using multi-temporal and multi-frequency SAR data in the context of flood mapping at River Saale, Germany. Remote Sensing, 7 (6), 7732-7752.
Practical report.
Introduction:
The aim of this practical is to determine and evaluate the changes in wetland extent in Bau Sau Vietnam. The following data were utilised in this practical to achieve the aim:
1. ers_1999_images.img: 4 images from ERS synthetic aperture radar acquired on 4 different dates. The correspond dates for each layer are:
- Layer 1 = 27th May 1999
- Layer 2 = 9th September 1999
- Layer 3 = 23rd December 1999
- Layer 4 = 11th January 2000
2. dem_10m.img: DEM at 10 m grid spacing.
3. uplands_mask.img: binary raster of 14 m spatial resolution showing only the lowland area and excluding the hilly regions.

4. Rainfall (mm / day) in the Bau Sau Wetlands, Vietnam, from January 1998 to January 2001 (figure (1)).
Pre-processing:
In order to minimise the influence of terrain backscatter, the image mask was applied to remove hilly regions using mask tool in Erdas Imagine (figure(2)).

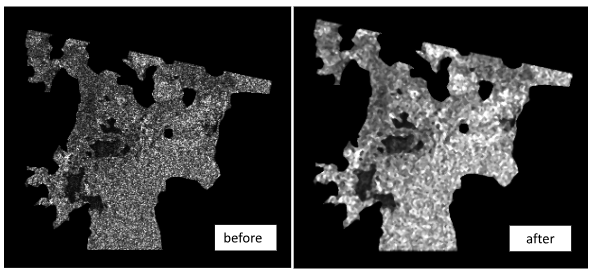
Secondly, for reducing the spackle noise, spackle filter was used in Erdas Imagine by using Radar Spackle Suppression tool. According to Kuenzer et al. (2013), median filter with moving window of size 5 x 5 pixels was utilised in the study of detecting flood areas. Therefore, median filter was tried in this practical with different kernel sizes. The best result was in two iterations of median filter with window moving of sizes 3x3 and 5x5 respectively. The filtered image has preserved the edges of key features and appeared reasonably smooth (figure 3).
Processing:
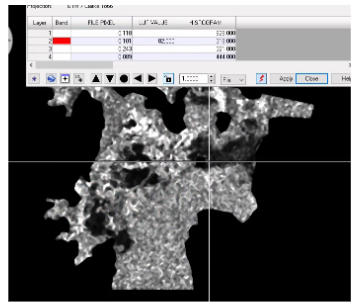
In order to identify the threshold value of flooded area, the inquire tool in Erdas imagine was utilised. The flooded area looks dark in the radar image, therefore, the inquire tool was applied in the dark area and the threshold value was about 0.1.
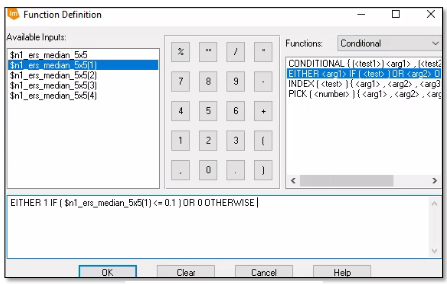
Then, conditional function, either, was used in Model Maker to classify the flooded areas that have threshold value of equal or less than 0.1. Figure (5) shows the function definition used in Model Maker for each layer.

Using ArcMap software:

The 4 images above were uploaded as input data in ArcMap. The images were converted from raster to shapefile using conversion, raster to polygon, tool. Then, intersect tool was applied for all the 4 images to extract the common areas of wetland extent. These common areas present the approximate permanent lakes and ponds. Individual thematic maps were designed as shown in figure (7) and the common areas of wetland, permanent lakes, were highlighted with blue colour.

Evaluation:
The area of wetlands, includes permanent lakes, was calculated in Erdas imagine software for each layer through table> show attributes> add area. Graph (1) represents the change in wetlands over time for 4 dates. The wetlands area remained approximately steady from May 1999 to September 1999 and this was due to continuous rains (figure (1)). Then, it decreased slightly in December 1999, as the amount of rain decreased (figure (1)). Finally, it has been again increased sharply in January 2000 to reach 4881.79 hectares. This increase could be duo to snow melting from mountains as the flooded areas are located near the mountain (figure (6)).

References:
1. Martinis, S.; Kuenzer, C.; Twele, A. Flood Studies Using Synthetic Aperture Radar Data. Remote Sensing of Water Resources, Disasters and Urban Studies; Taylor and Francis: London, UK, 2015.
Continue your exploration of Evaluating the Impact of Corporate Social with our related content.


- 24/7 Customer Support
- 100% Customer Satisfaction
- No Privacy Violation
- Quick Services
- Subject Experts